
Educational content only, not financial advice.Content may contain affiliate links.
This Tradingview Stock Screener guide will show you how to to find the best stocks for your trading or investing strategy.
Whether you’re focused on US markets or global equities, this tutorial will help you narrow down thousands of symbols to a manageable, high-quality list.
Introduction to the Tradingview Stock Screener
The Tradingview Stock Screener is an essential tool for traders looking to filter through thousands of stocks to find those that match their specific criteria. With its powerful features and user-friendly interface, you can easily navigate through a vast array of data, ensuring you make informed trading decisions.
Whether you’re a beginner or a seasoned trader, this screener can elevate your stock analysis process to new heights.
Navigating to the Stock Screener
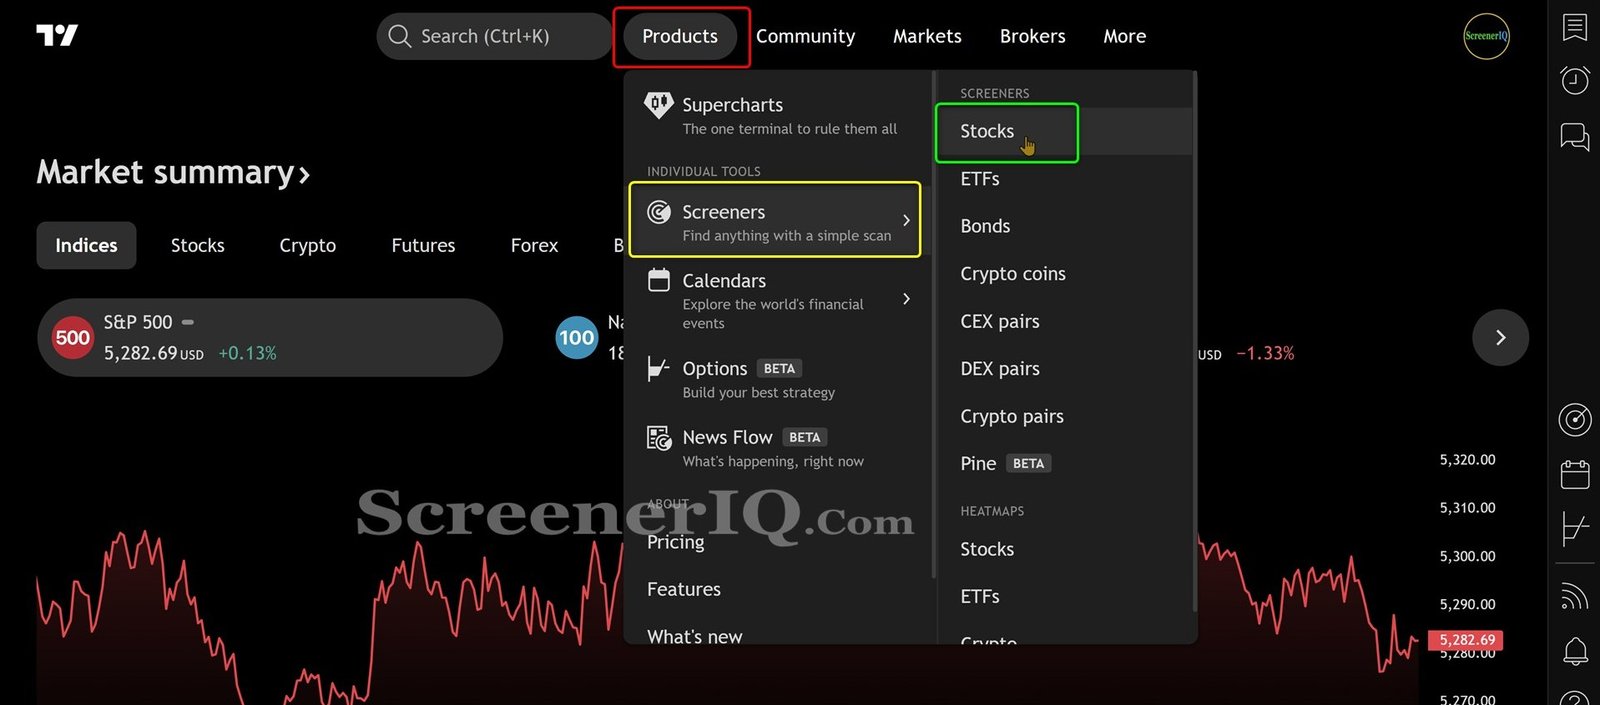
To access the Tradingview Stock Screener, simply visit Tradingview.
Hover your mouse over the Products tab, then click on Screener and select Stocks. This will take you directly to the screener interface, where you can start filtering stocks based on your trading strategy.
Click to enlarge images.
Overview of Screener Features
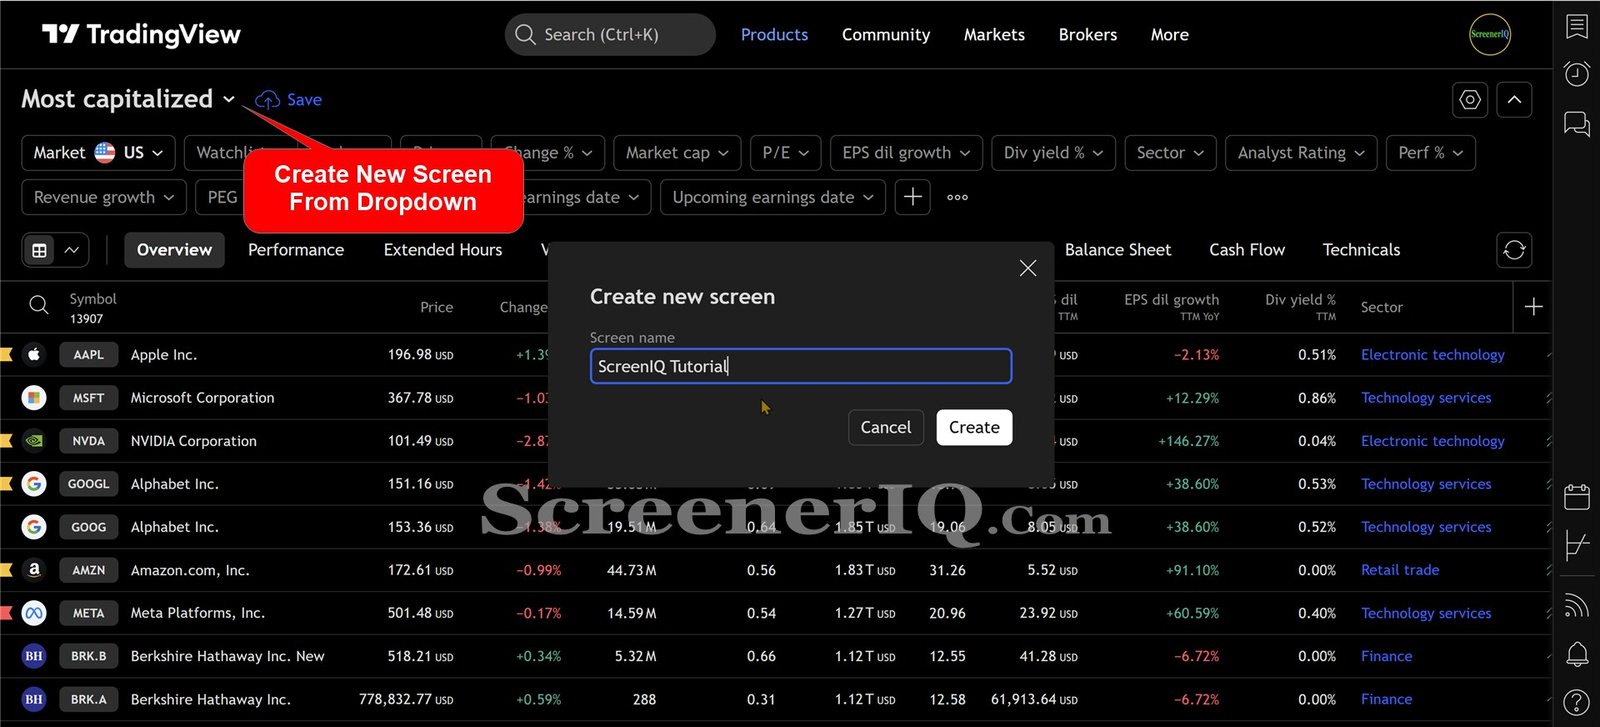
The Tradingview Stock Screener boasts a range of features designed to enhance your stock selection process. At the top, you’ll find a drop-down menu that allows you to save your screens, export results, or open previously saved screens. This functionality is crucial for traders who wish to maintain organized screening sessions.
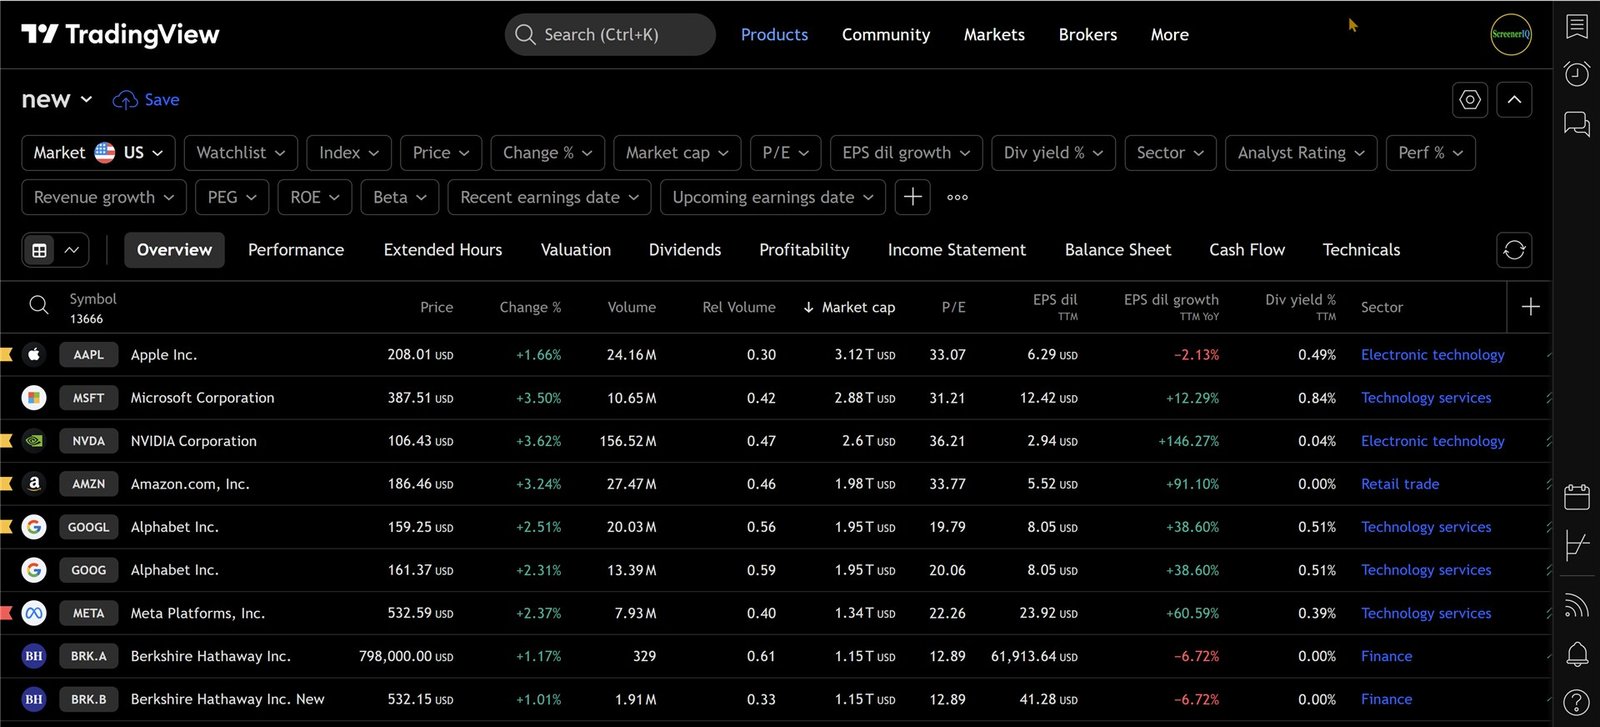
Another key feature is the extensive range of filters available. With nearly 14,000 symbols initially displayed, you can quickly narrow down your choices using filters. Such as market capitalization, sector, price-to-earnings ratio, and other metrics that matter to you.
Setting Up Your First Screen
Once you have accessed the screener, it’s time to set up your first screen. Start by clearing any existing filters to begin with a clean slate. You can then apply filters based on your preferences.
Understanding Filters: Narrowing Down Your Search
Filters are the backbone of the Tradingview Stock Screener. By using them effectively, you can narrow down your search to find the stocks that align with your trading strategy.
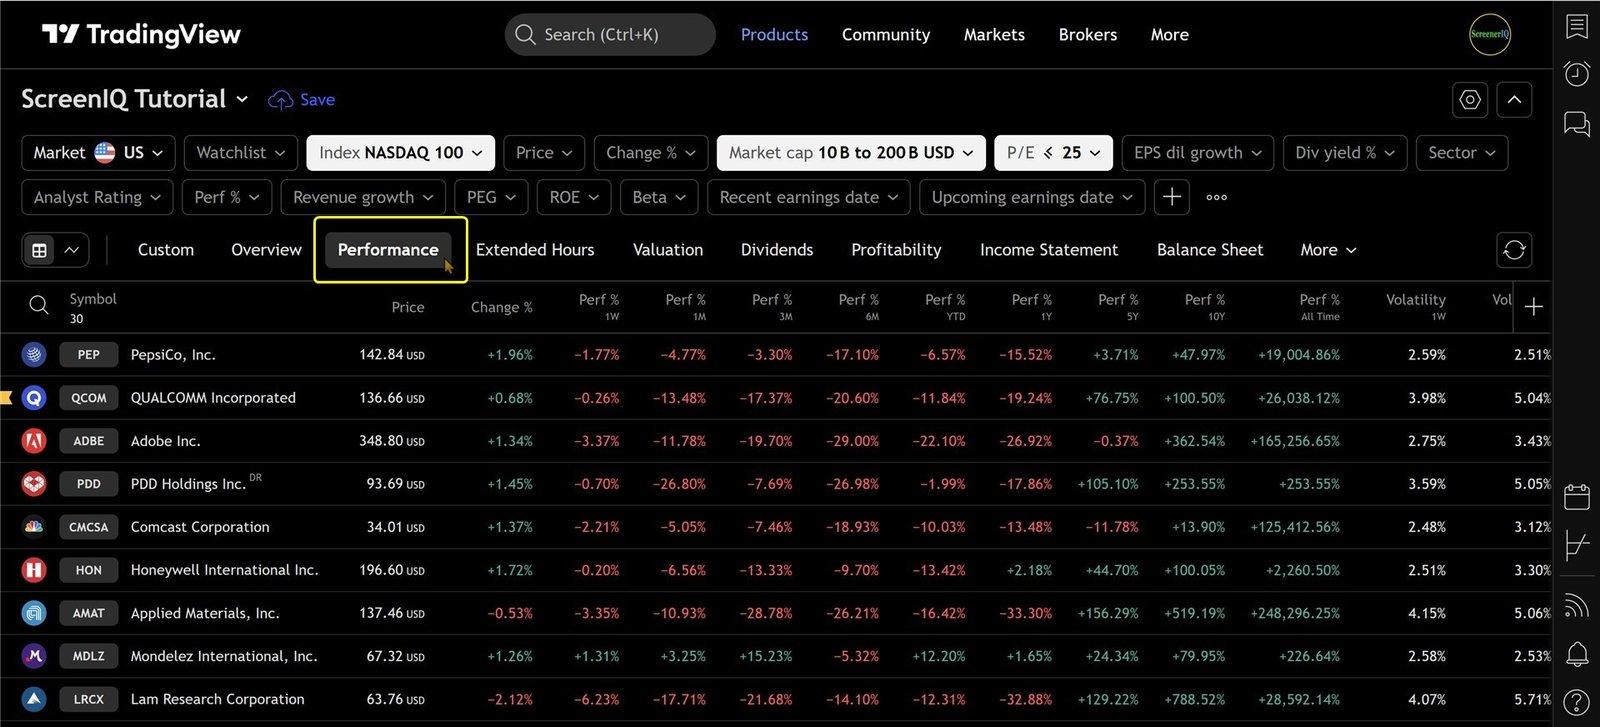
For example, if you want to focus on stocks in the Nasdaq 100, simply check the appropriate box from the drop down options.
Do the same for your market cap filter. You can add additional criteria, like a price-to-earnings ratio of 25 or below, to further refine your results.
- Market Cap: Set a minimum threshold to focus on larger companies.
- Price-to-Earnings Ratio: Identify value stocks by setting a maximum ratio.
Exploring Company Overviews
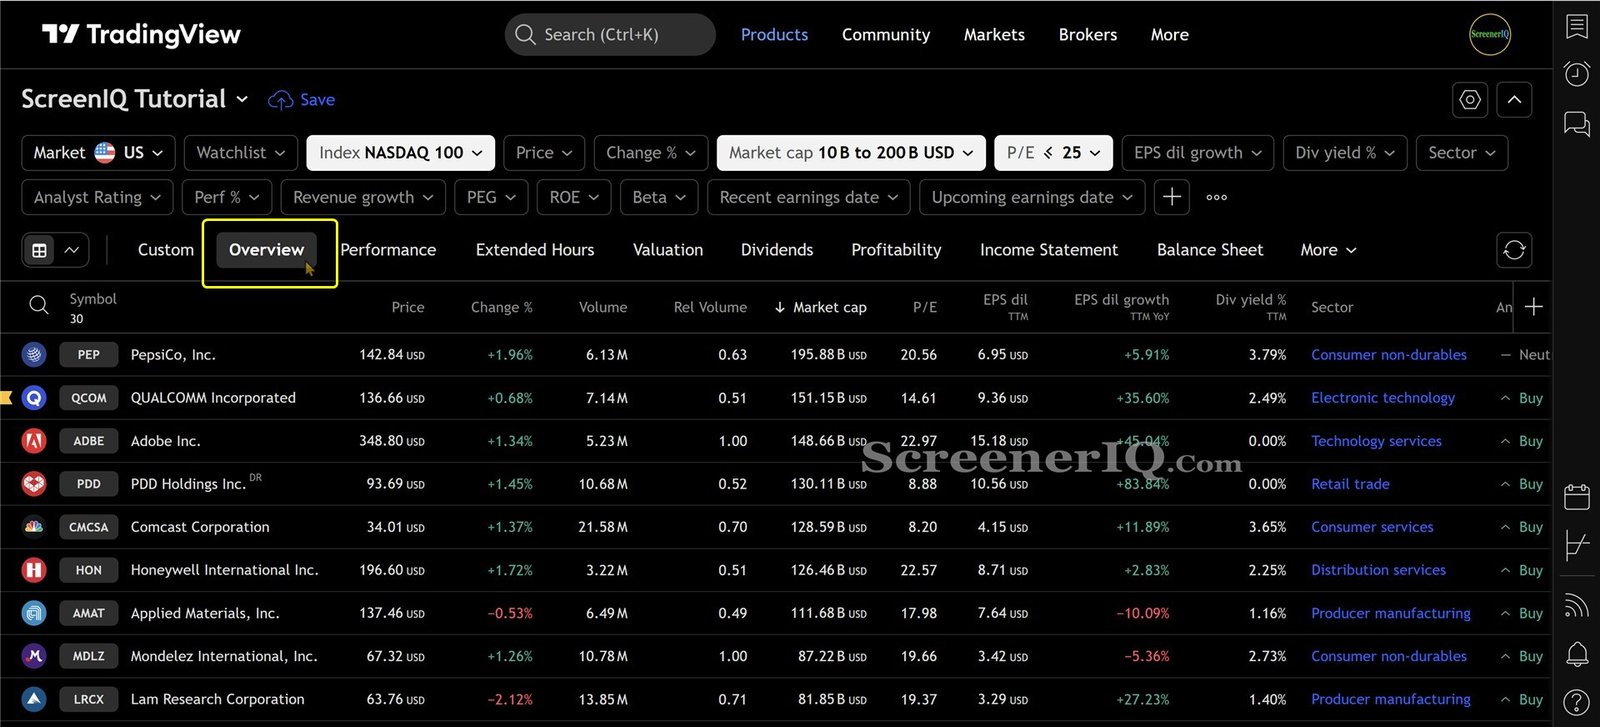
After filtering your stocks, the next step is to explore the company overviews. Click on the Overview tab to view essential information about each stock, including price, percentage change, volume, and sector.
This overview provides a quick snapshot of how each stock is performing, allowing you to assess potential investments quickly.
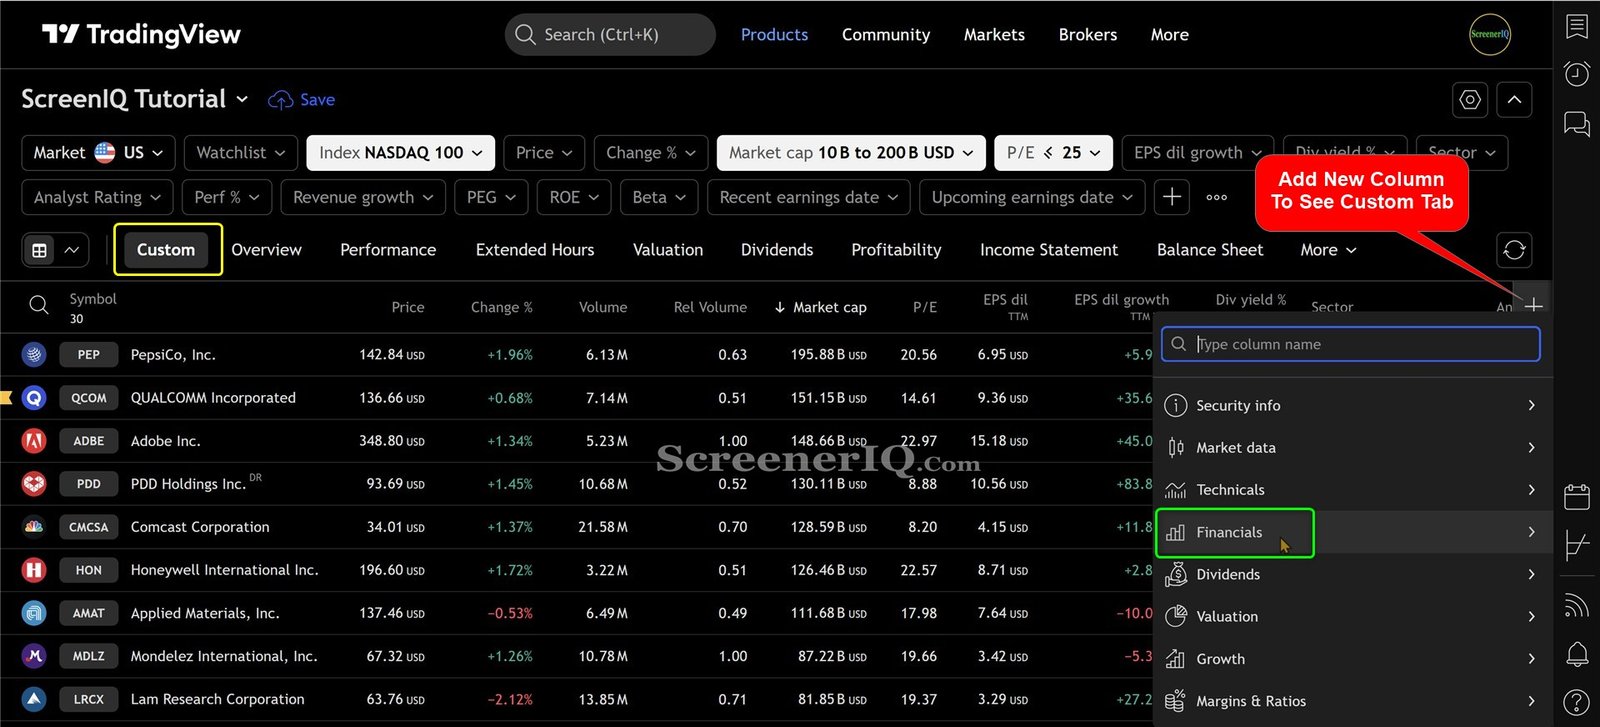
Customizing Your View: Adding and Removing Columns
Customization is a key feature of the Tradingview Stock Screener. You can easily add or remove columns based on the data you want to see.
For instance, if you want to track analyst ratings or gross margin percentages, you can click on the Custom tab and drag the desired metrics into your view.
Tip: If you do not see the Custom tab.
The custom button will appear when you modify the column set. Either by adding a column by using the [+] button or removing a default column.
This flexibility allows you to tailor the screener to fit your trading needs perfectly.
To customize your screen:
- Click the Custom tab.
- Click the [+] button to add metrics you want to include.
- Remove any columns that are not relevant to your analysis.
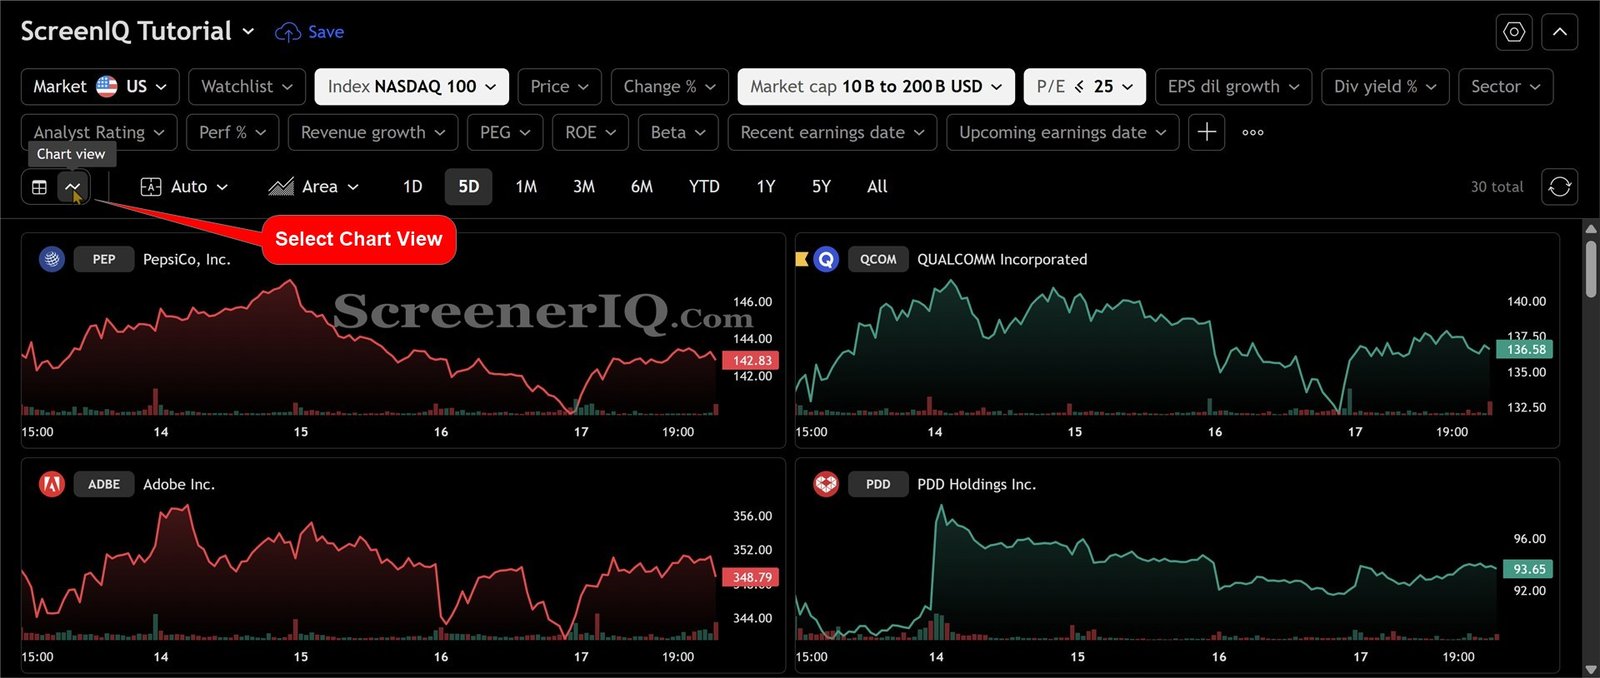
Using Chart View for Screener Results
The Chart View feature in the Tradingview Stock Screener allows you to visualize multiple stocks simultaneously, giving you a broader perspective on market trends.
This is particularly useful for long-term traders who want to analyze price movements over extended periods.
To access Chart View, simply click on the Chart tab after setting your filters. You can select the time interval that suits your trading strategy—be it daily, weekly, or monthly.
By viewing all selected stocks in a unified chart format, you can easily compare performance and identify which stocks are trending positively.
Understanding the Importance of Time Intervals
When setting up your Chart View, consider the time interval that best aligns with your trading goals.
For example, if you’re a long-term investor, a five-year view will provide insights into long-term trends and price stability. Conversely, day traders may prefer a one-minute or five-minute view to capture short-term movements.
With the ability to zoom in and out, you can quickly switch between different time frames to assess market conditions as they evolve.
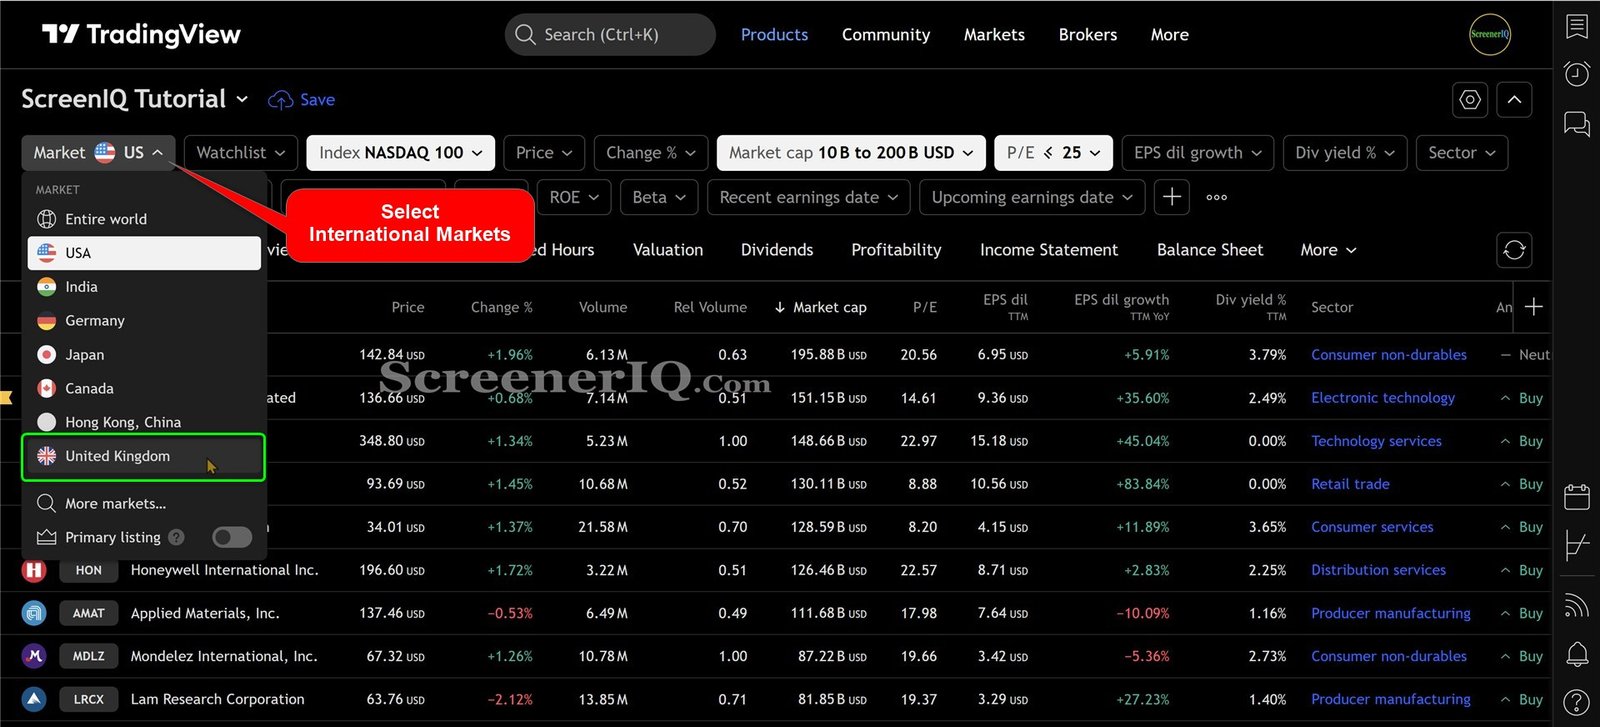
Global Market Screening: Accessing International Stocks
The Tradingview Stock Screener isn’t limited to just U.S. stocks; it offers a global perspective that allows you to filter stocks from various countries. This feature is essential for traders looking to diversify their portfolios and tap into international markets.
To access international stocks, click on the Market dropdown menu. Here, you can select specific countries or regions, such as Japan or the United Kingdom, and screen for stocks based on your criteria.
Filtering by Country or Region
- Market Cap: Set a minimum threshold to focus on larger companies globally.
- Dividend Yield: Filter for companies offering dividends, enhancing your investment strategies.
- Primary Listings: Focus on the main stock listings to avoid duplicates.
This feature allows you to easily access over 105,000 symbols from around the world, enabling comprehensive analysis and investment opportunities.
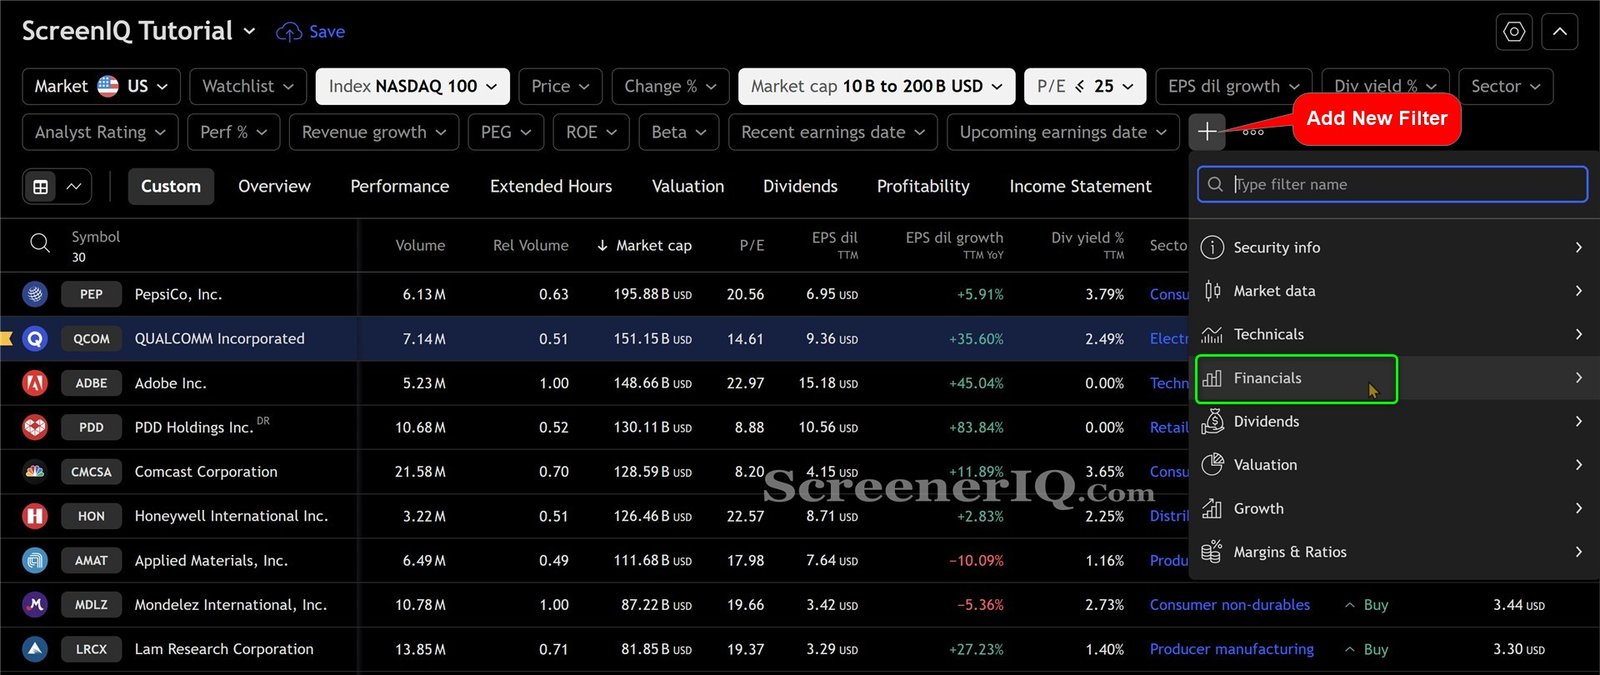
Advanced Filtering Techniques
Advanced filtering techniques are where the Tradingview Stock Screener truly shines. By using the + Add New Filter button, you can add specific metrics that align with your investment strategy.
For instance, if you’re interested in value stocks, you can set filters for Price-to-Earnings ratios, market cap, and even analyst ratings.
This allows you to create a highly customized screener tailored to your investment philosophy.
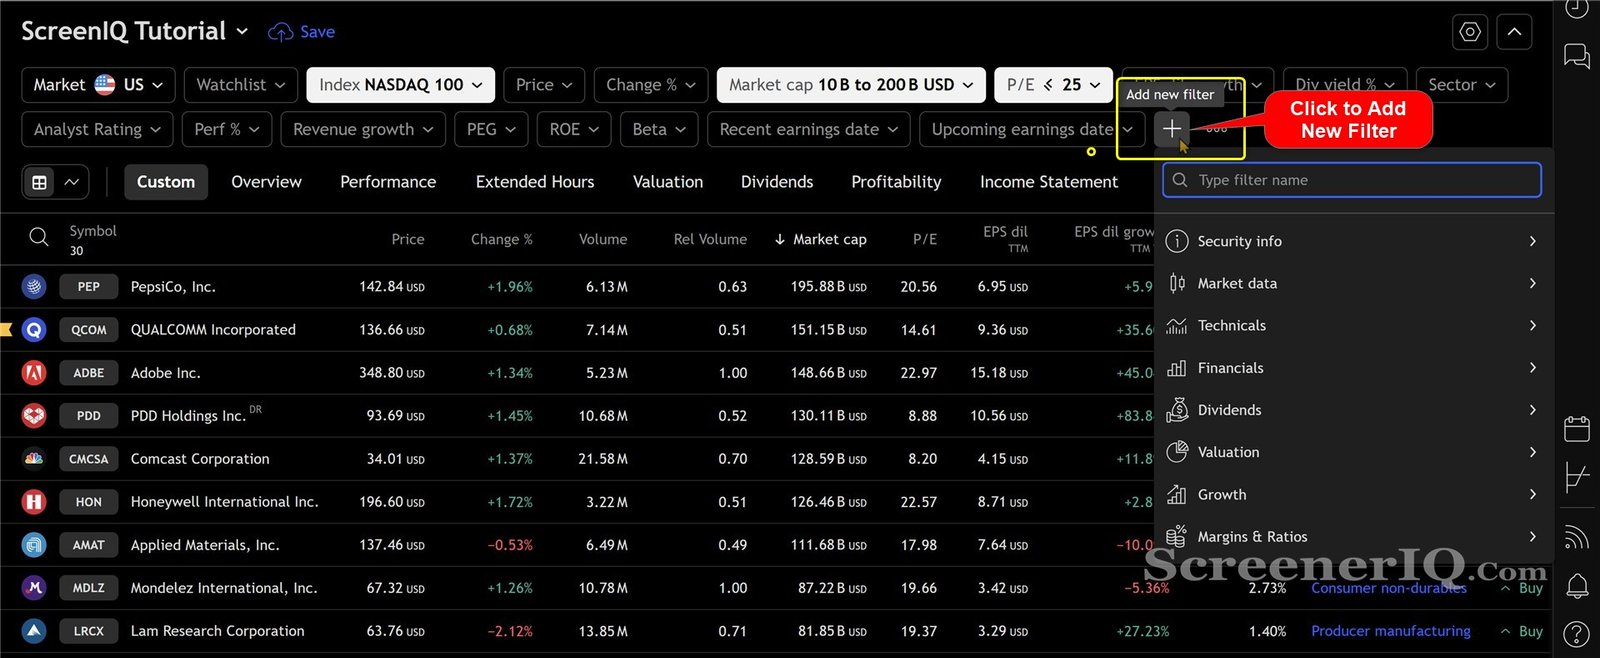
Creating a Custom Filter Strategy
- Select the + Add New Filter option.
- Choose from a variety of metrics such as net debt, cash flow, or technical indicators.
- Refine your search to yield a list of stocks that meet your specific criteria.
This level of customization empowers you to uncover hidden gems in the market that you might have otherwise overlooked.
In-Depth Understanding of Security Info
The Security Info feature provides crucial insights into individual stocks. By clicking on this option, you can access a wealth of information, including analyst ratings, country of registration, and float shares percentage.
This data is invaluable for making informed investment decisions. For example, knowing the analyst ratings can help you gauge market sentiment about a particular stock.
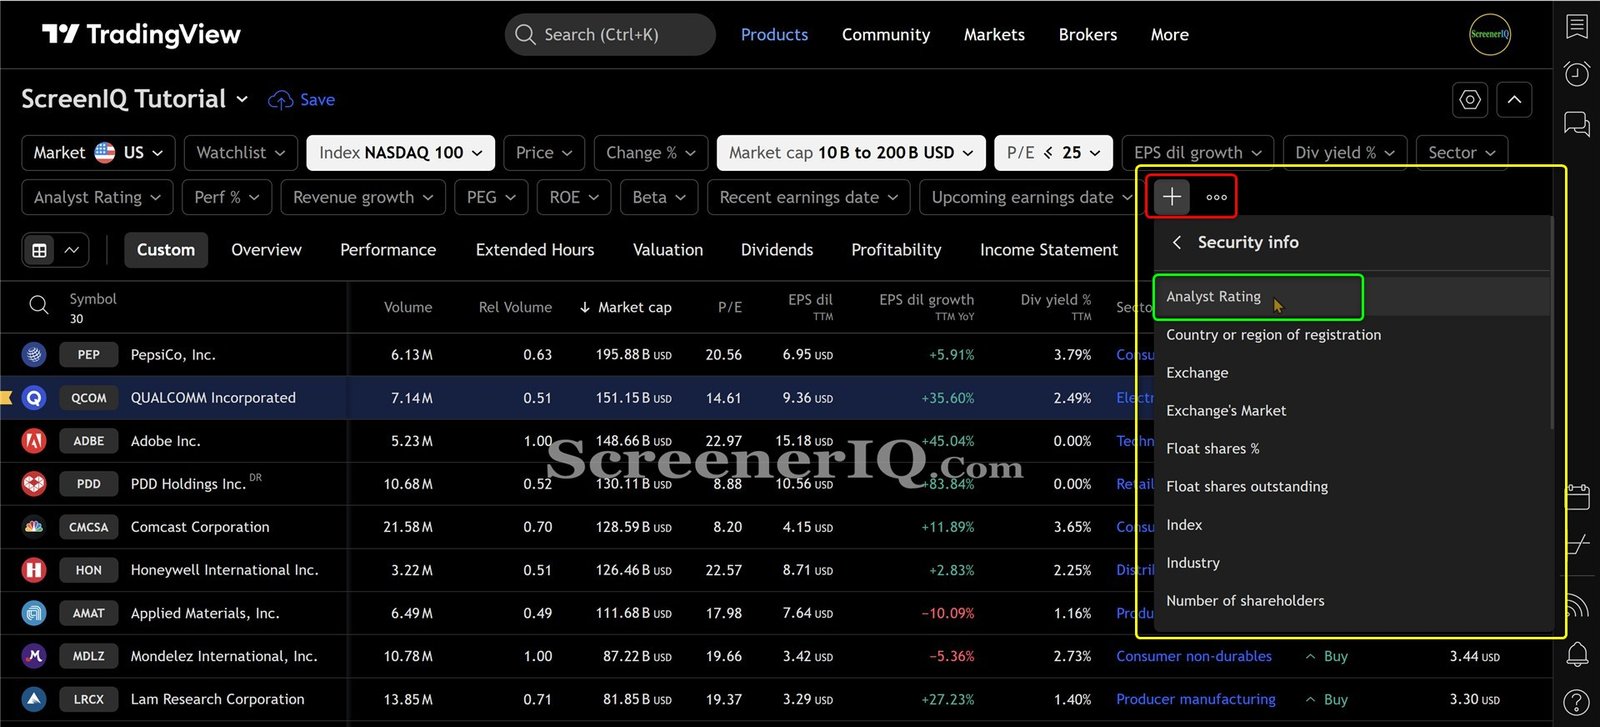
Key Metrics to Consider
- Analyst Ratings: A quick way to see how professionals view a stock.
- Country/Region: Understand where the company is based, which can affect its performance.
- Float Shares Percentage: A critical metric that indicates how many shares are available for trading.
By leveraging this information, you can make more strategic decisions that help with your trading goals.
Using Technical Indicators for Screening
For technical traders, the Tradingview Stock Screener offers a variety of technical indicators that can be integrated into your screening process.
This feature allows you to filter stocks based on technical criteria, such as Bollinger Bands or Relative Strength Index (RSI).
To add a technical indicator, simply click on the + Add New Filter button. Then from ‘Technicals’ select your desired technical indicator.
This will enable you to find stocks that meet specific technical setups required for your trading strategy.
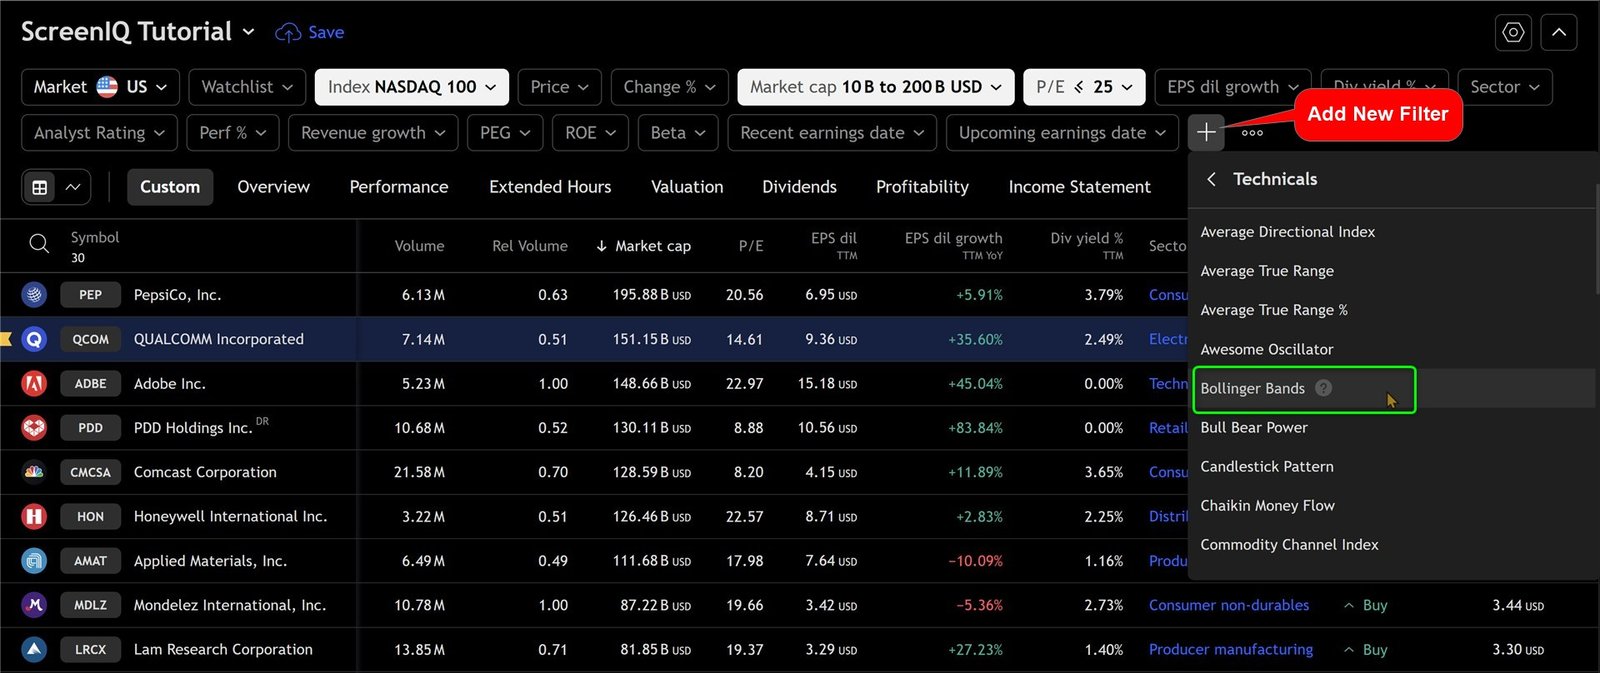
Examples of Useful Technical Indicators
- Bollinger Bands: Identify stocks that are trading within specific volatility ranges.
- Relative Strength Index (RSI): Find overbought or oversold conditions.
- Moving Averages: Determine trends and potential reversals.
Incorporating these indicators into your screening process could significantly improve your trading outcomes.
Managing Financials and Ratios
Financial metrics are essential for evaluating a company’s health and performance. The Tradingview Stock Screener allows you to filter stocks based on various financial criteria, such as cash flow, earnings, and debt levels.
To effectively manage these financials, navigate to the Financials section and select the metrics that matter most to you.
For example, if you’re interested in companies with strong cash positions, you can set a filter for cash and equivalents above a certain threshold.
Key Financial Ratios to Monitor
- Price-to-Earnings (P/E) Ratio: Assess if a stock is overvalued or undervalued.
- Debt-to-Equity Ratio: Understand a company’s leverage and risk.
- Return on Equity (ROE): Measure how effectively a company uses shareholder funds.
By focusing on these financial metrics, you can make more informed investment decisions.
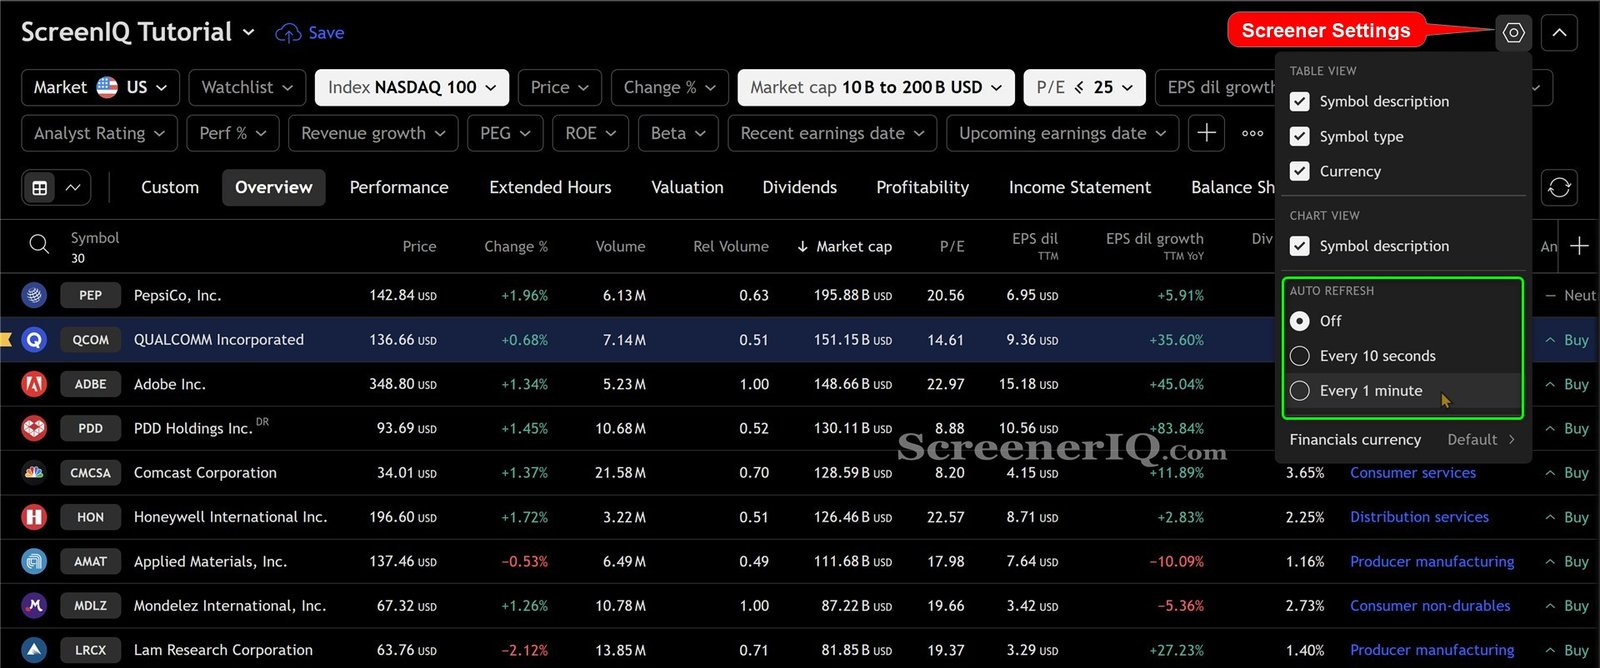
Real-Time Data and Auto Refresh Features
One of the standout features of the Tradingview Stock Screener is its ability to provide real-time data. This is crucial for traders who need to make quick decisions based on current market conditions.
The Auto Refresh feature allows your screener to update automatically, ensuring you have the most current data at your fingertips.
You can set the refresh interval to your preference, whether every 10 seconds or every 1 minute.
This ensures that you’re always working with the most current data, allowing you to make timely decisions.
Benefits of Real-Time Data
- Informed Decisions: Make timely investment decisions based on the latest market movements.
- Enhanced Monitoring: Keep track of multiple stocks simultaneously without manual updates.
- Adaptability: Quickly adjust your trading strategy based on real-time data feeds.
This feature is indispensable for active traders.
Screening Directly from Charts
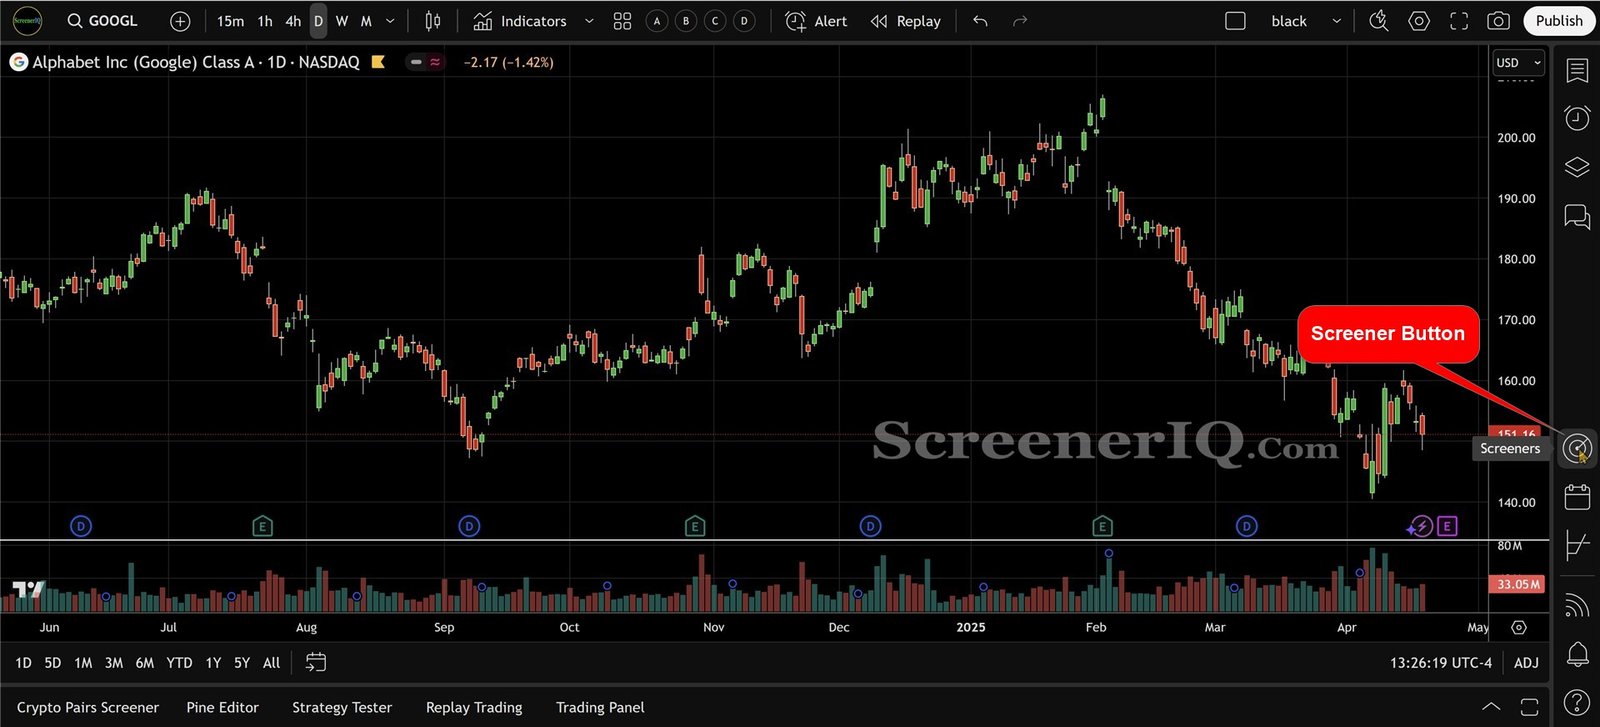
One of the standout features of the Tradingview Stock Screener is the ability to screen directly from your charts. This functionality allows you to analyze price movements and trends while simultaneously filtering stocks that meet your criteria.
To access this feature, simply click on the screener button located at the bottom right of your chart. This opens the screener interface without disrupting your charting view.
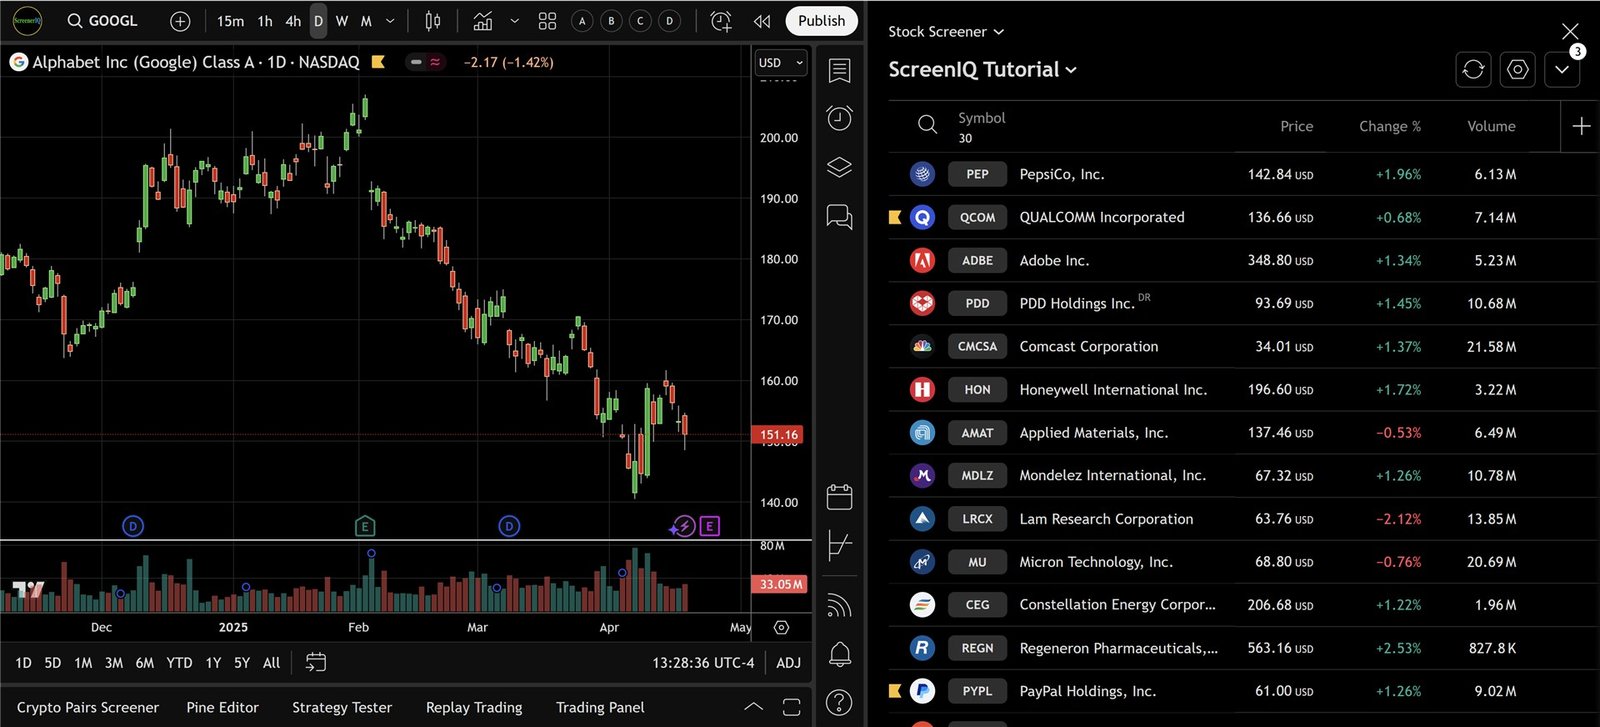
Advantages of Screening from Charts
- Real-Time Analysis: Monitor charts while filtering stocks based on real-time data.
- Multi-Tasking: Easily switch between chart analysis and stock screening to find optimal trading opportunities.
This dual functionality improves your trading experience, allowing for more informed decision-making.
Exporting Your Screens for Offline Use
For those who prefer to analyze data offline, the Tradingview Stock Screener offers an export feature. This allows you to download your screening results and work on them at your convenience.
To export your data, simply click the export button located in the drop-down menu at the top of the screener. You can choose to save your results in formats such as CSV or Excel, making it easy to perform further analysis or share with others.
This feature is particularly useful for traders who conduct in-depth research or want to keep a record of their screening sessions.
Summary
In conclusion, mastering the Tradingview Stock Screener can significantly improve your trading strategy. By customizing your settings, screening directly from charts, and exporting screens for offline use, you can create a tailored experience that meets your unique needs.
As you continue to explore the features of the screener, consider integrating it with your broader trading strategy. Experiment with different filters, and don’t hesitate to revisit your saved screens as market conditions change.
Ready to take your trading to the next level?
Try the Tradingview Stock Screener today, and start filtering out the noise to find the stocks that truly matter to you.
FAQs
How do I access the Tradingview Stock Screener?
Visit tradingview, hover over the Products tab, click on Screener, then select Stocks.
Can I filter stocks from international markets?
Yes, the Tradingview Stock Screener allows you to filter stocks from various countries and regions globally.
Is it possible to save my screens for future use?
Absolutely! You can save your screens in the drop-down menu for easy access later.
What formats can I export my screens to?
You can export your screens in formats like CSV or Excel, making it convenient for offline analysis.
Can I use technical indicators in my screening process?
Yes, the screener includes various technical indicators that you can integrate into your filters to find stocks that meet specific technical criteria.