
This CAN SLIM screener finds growth stocks before they make their biggest moves. William O’Neil’s CAN SLIM methodology has helped countless investors identify market winners through a systematic approach combining fundamental and technical analysis.
This comprehensive guide will show you how to implement a CAN SLIM stock screener to discover high-potential growth stocks that could deliver market-beating returns.
Understanding the CAN SLIM Methodology
The CAN SLIM methodology, (often referred to simply as CANSLIM) is a proven growth stock selection strategy developed by William O’Neil, founder of Investor’s Business Daily.
The system identifies companies with strong fundamentals, technical strength, and institutional support, all factors that historically precede explosive price movements.
The CAN SLIM acronym represents seven critical factors that O’Neil found common among the market’s biggest winners before their major price advances:
- C = Current quarterly earnings
- A = Annual earnings growth
- N = New product, service, management, or price high
- S = Supply and demand
- L = Leader or laggard
- I = Institutional sponsorship
- M = Market direction
Let’s go deeper into each factor.
Breaking Down the CAN SLIM Components
C – Current Quarterly Earnings
Strong recent earnings growth is the foundation of the CAN SLIM approach. O’Neil’s research showed that stocks making the biggest gains typically had quarterly earnings increases of at least 25% year-over-year before their price surge began.
Example: A company reporting $1.25 earnings per share compared to $1.00 in the same quarter last year shows a 25% increase—meeting the minimum threshold for this criterion.
A – Annual Earnings Growth
Consistent annual earnings growth demonstrates sustainable business performance. The CANSLIM method looks for companies with annual earnings growth of at least 25% over the past three years, with accelerating growth rates being particularly favorable.
Example: A company with EPS growth of 28%, 32%, and 35% over the past three years shows the ideal pattern of consistent and accelerating annual growth.
N – New Products, Management, or Highs
Companies introducing innovative products, services, or experiencing positive management changes often see stock price appreciation. Additionally, stocks making new 52-week highs frequently continue their upward momentum.
Example: A pharmaceutical company receiving FDA approval for a breakthrough drug, or a tech company launching an innovative product that opens new market opportunities.
S – Supply and Demand
The law of supply and demand affects stock prices. Companies with a smaller supply of outstanding shares can experience more dramatic price movements when demand increases. Look for increasing trading volume as prices rise—a sign of institutional accumulation.
Example: A stock trading 50% more volume than its 50-day average while making new highs indicates strong demand potentially driving further price increases.
L – Leader or Laggard
Focus on industry leaders showing relative strength compared to both the market and their peers. The best performers typically have a Relative Strength rating of 80 or higher, meaning they’re outperforming 80% of all stocks in the market.
Example: A software company with a relative strength rating of 95 is outperforming 95% of all stocks—a strong indicator of market leadership.
I – Institutional Sponsorship
Stocks with increasing ownership by professional investment firms often experience sustained price growth. Look for companies with at least 3-10 institutional owners with strong performance records, but avoid stocks where institutional ownership exceeds 70% (limited room for additional buying).
Example: A mid-cap stock showing increasing positions from top-performing mutual funds in recent quarters indicates growing institutional interest.
M – Market Direction
The overall market direction significantly impacts individual stock performance. O’Neil estimated that 75% of stocks move in the same direction as the general market, making it crucial to align your buying with uptrending markets.
Example: Check that the S&P 500 is trading above the 200-day moving averages with increasing volume indicates a favorable market environment for CANSLIM stocks.
Key Insight: The CAN SLIM methodology is not just about finding companies with good fundamentals—it’s about finding companies with accelerating fundamentals at the right time in both their business cycle and the market cycle.
From all the info above, here is a CANSLIM screener filter you can use.
Note: This is a starting point. You can adjust the filters to your own requirements.
CAN SLIM Screener Filter
C – Current Earnings:
EPS % Change (Q vs Q 1 Yr Ago): ≥ 25%
Sales % Change (Q vs Q 1 Yr Ago): ≥ 25%
A – Annual Earnings Growth:
EPS Growth (5 Yr): ≥ 25%
Return on Equity (TTM): ≥ 17%
N – New Products/Highs:
Price % of 52 Week High: ≥ 80%
(keeps stocks within ~20% of highs)
S – Supply and Demand:
Shares Outstanding: ≤ 50M
Average Volume (20 Day): ≥ 200,000
L – Leader or Laggard:
Relative Strength (vs S&P 500, 1 Year): ≥ 80
(Stock Rover uses % rank; if not available, use % Change (52 weeks) ≥ 25% as proxy)
I – Institutional Sponsorship:
Institutional Ownership: ≥ 5%
Institutional Ownership % Change (1 Year): > 0% (growing sponsorship)
M – Market Direction:
Not a screener setting. Check Stock Rover Market Indicators (or external index charts). Only run screen during a confirmed market uptrend.
Choosing The Best Stock Screener Platform For The Job
Note that not all stock screeners have all the filter options available. For example, ‘Institutional Ownership‘ is a key part of the CANSLIM methodology.
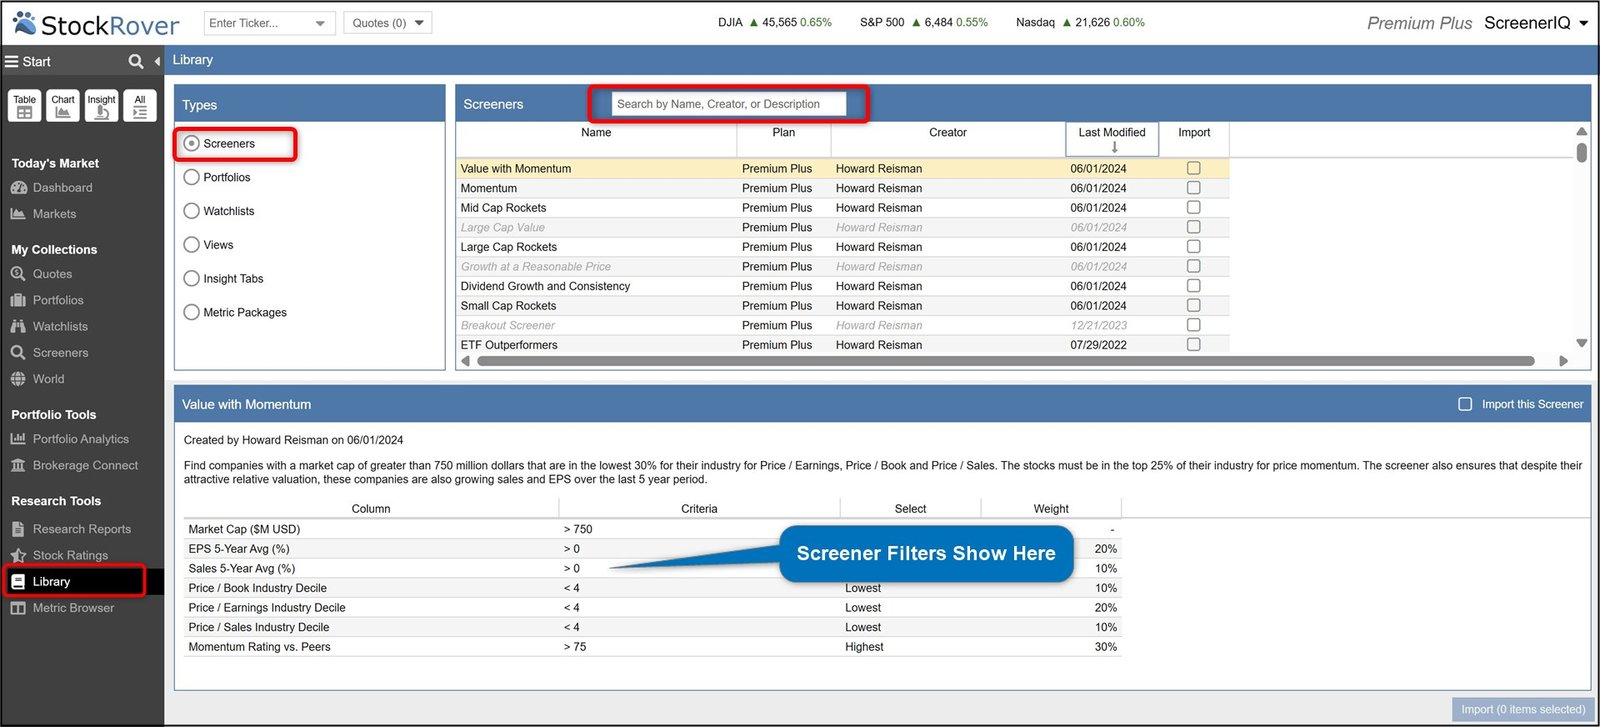
Stock Rover is one of the best stock screening platforms that allows for detailed fundamental and technical filters.
Start Finding CANSLIM Stocks Today
Get access to pre-built screeners and comprehensive stock analysis with Stock Rover.
Stock Rover has a complete library of prebuilt stock screeners, covering every angle you can think of.
They actually have their own versions of CAN SLIM screeners and 10+ years of financial data.
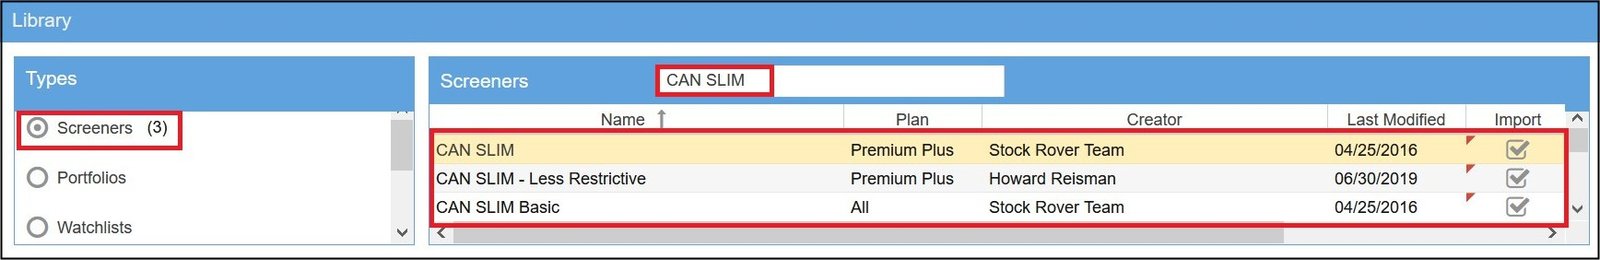
Above we have searched for ‘CAN SLIM’ and we get 3 options.
You can import them with one click, into your own screener list to use. This saves an incredible amount of time.
CAN SLIM Screeners Performance
But how have these CANSLIM screeners performed over time?
let’s have a look.
I’m only going to focus on the following screeners:
1) CAN SLIM
2) CAN SLIM – Less Restrictive
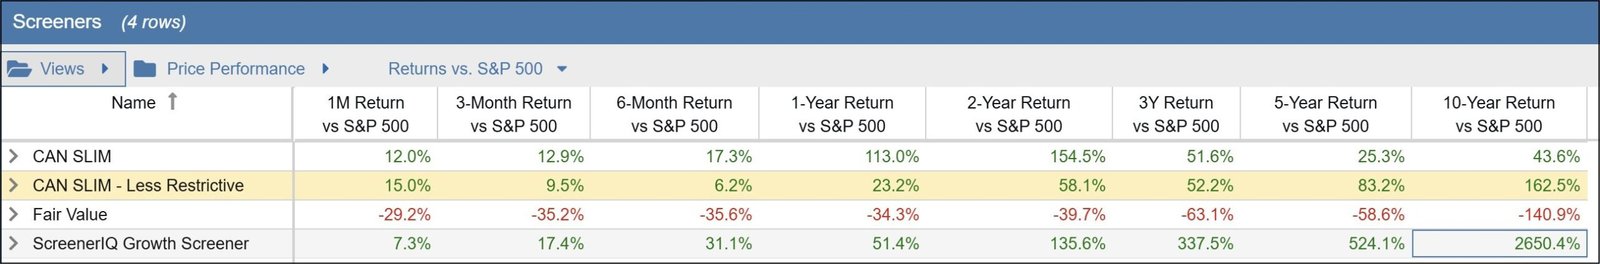
Above you can see the returns vs S&P 500, 1-Month to 10-Year returns, for the Stock Rover CAN SLIM screeners.
The ‘CAN SLIM‘ version has performed better over 3 years.
But the ‘CAN SLIM – Less Restrictive‘ version has performed better over 5 to 10 years.
Below is the ‘CAN SLIM – Less Restrictive’ vs the S&P 500 over 10 years.
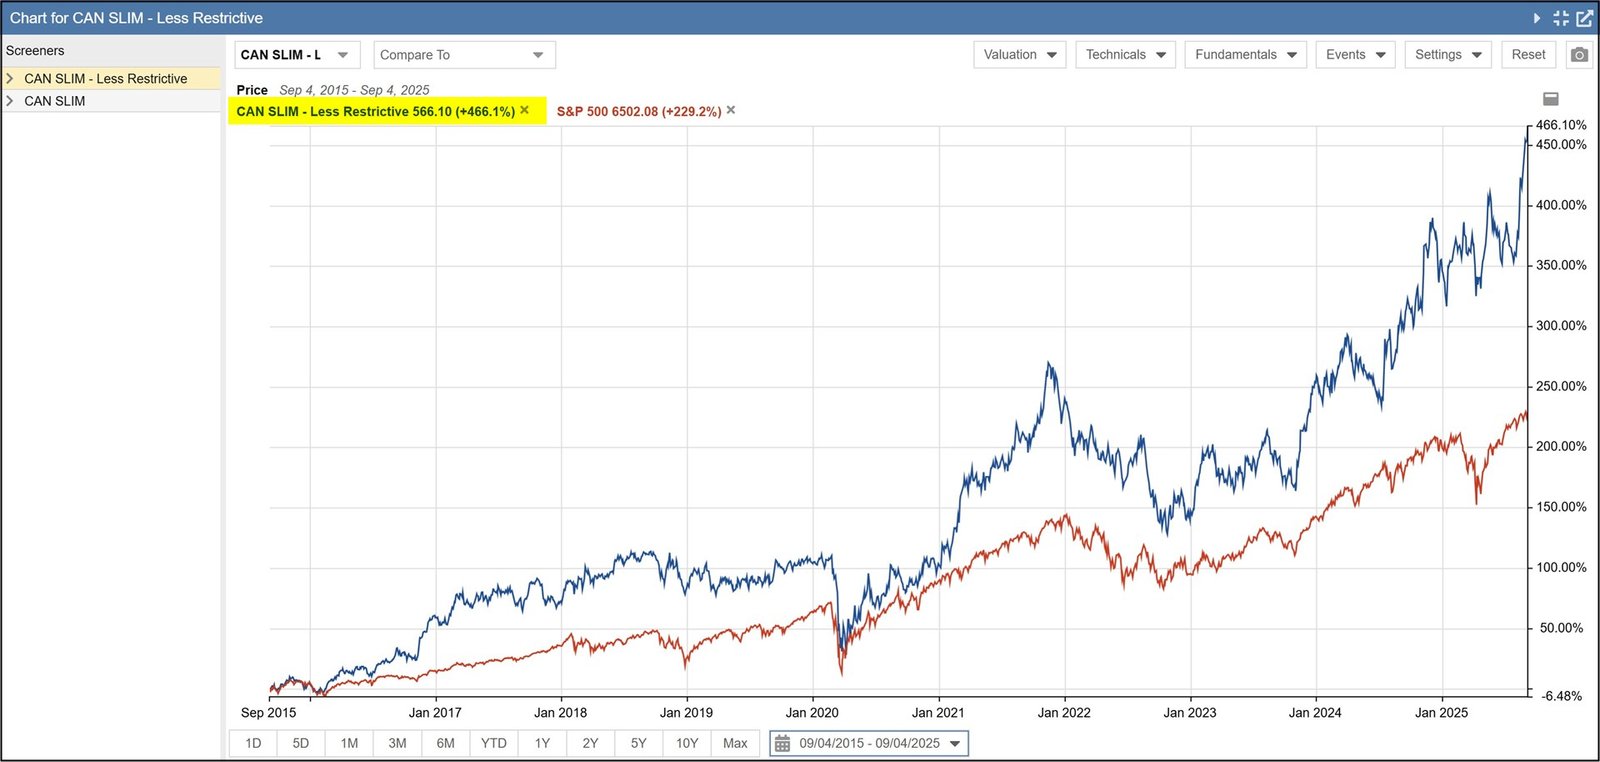
The ‘CAN SLIM – Less Restrictive’ screener vs the S&P500 performance over 10-years is shown in the chart above.
| CAN SLIM – Less Restrictive – 10-Years | +466% |
| S&P500 – 10-Years | +229% |
But as I mentioned above, when I gave you the basic filter: This is a starting point. You can adjust the filters to your own requirements.
CAN SLIM Screener Results
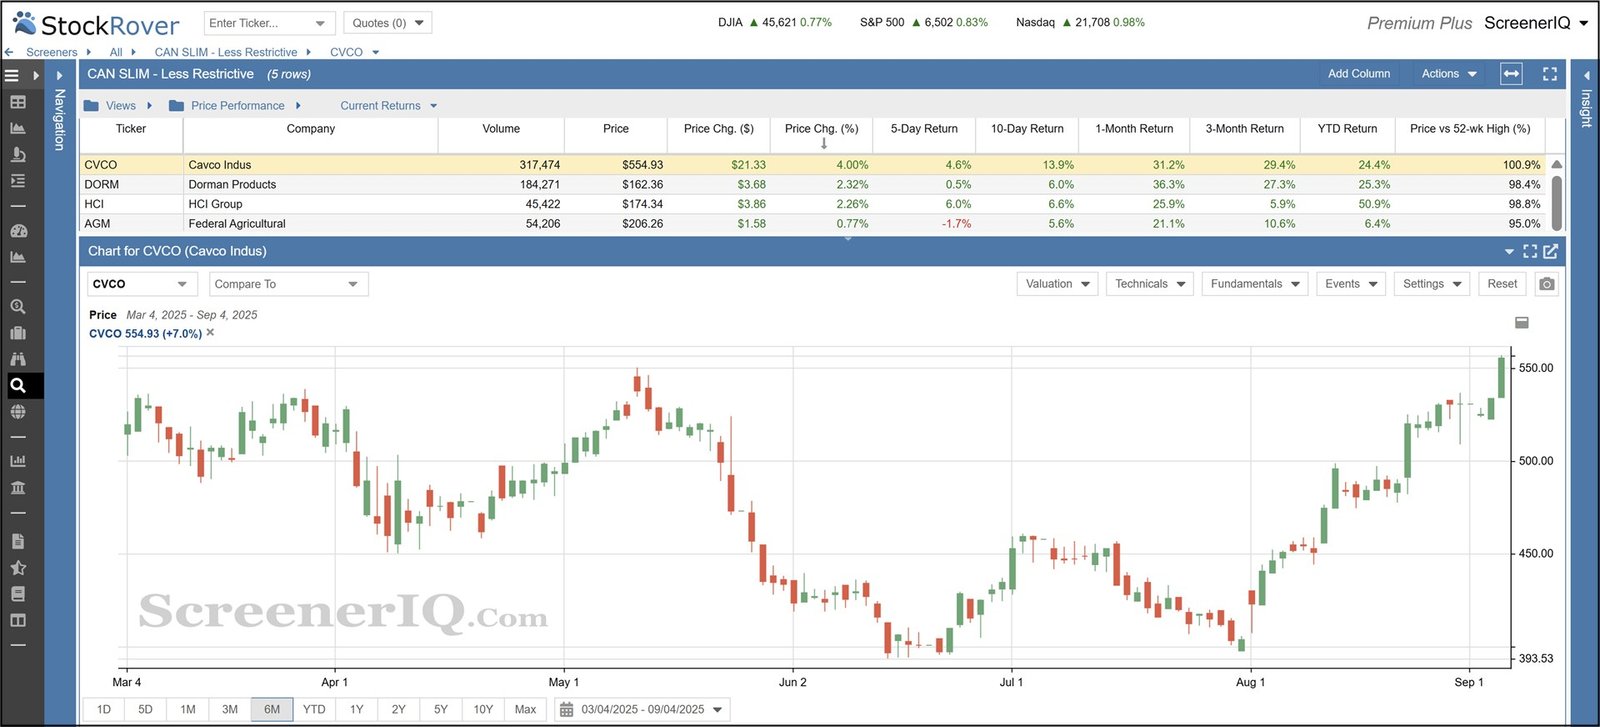
When your stock screener gives you a list of stocks, this is just the start of the process. You need to further analyze the stocks to see if any are worthy of your hard earned money.
Refine Your Results With Fundamentals
After running your initial screen, further check your results:
Earnings Stability: Check for consistent earnings growth (no more than one down quarter in the past 8 quarters).
Sales Growth: Check for a minimum 20% sales growth to ensure earnings growth is supported by actual business expansion.
Profit Margins: Look for expanding profit margins year-over-year (indicates improving business efficiency).
Debt-to-Equity Ratio: Check for companies with manageable debt (typically D/E ratio below 1 for most industries).
Industry Group Strength: Focus on stocks in industry groups ranked in the top 40 out of 197 industries.
Analyze Chart Patterns
CANSLIM is not just about fundamental screening—technical analysis plays a crucial role. After identifying candidates through your screener, examine their charts for these patterns:
Base Patterns to Look For:
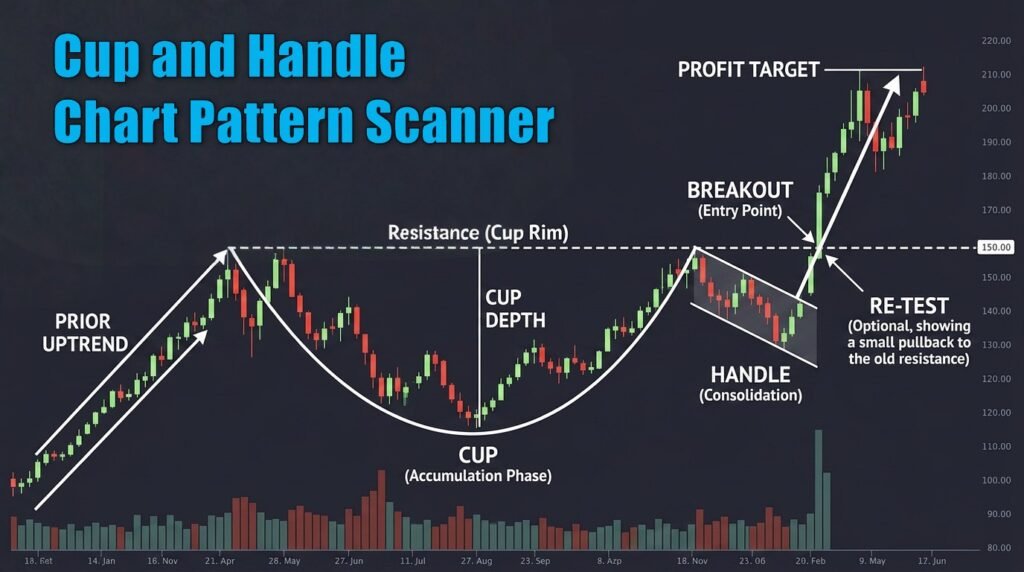
Cup with Handle: A U-shaped consolidation followed by a short pullback forming a handle.
Double Bottom: A W-shaped pattern showing two distinct lows at approximately the same price level.
Flat Base: A sideways consolidation with price movement typically within 15% from high to low.
High, Tight Flag: A rare pattern showing at least a 100% price increase followed by a short consolidation.
Time Your Entries and Exits
Proper entry and exit timing is critical for CANSLIM success:
Entry Rules:
- Buy when stock breaks out of a proper base on high volume (at least 40% above average).
- Focus on stocks breaking out to new highs after a period of consolidation.
- Ensure the general market is in an uptrend (above major moving averages).
- Consider a pilot position first (1/3 of intended position) and add on strength.
Exit Rules:
- Cut losses at 7-8% below purchase price (non-negotiable rule).
- Take profits when a stock shows distribution (high-volume selling).
- Consider selling if a stock rises 20-25% from a proper base in 3 weeks or less.
- Sell if fundamentals deteriorate (earnings slowdown, declining sales).
Remember that CAN SLIM is a stock selection strategy, not just a screener.
Benefits and Limitations of the CAN SLIM Strategy
Benefits of CAN SLIM
- Systematic Approach: Provides a clear, rules-based methodology for stock selection.
- Combines Technical and Fundamental: Integrates the best of both analytical approaches.
- Focus on Winners: Targets stocks with proven performance rather than speculative turnarounds.
- Risk Management: Includes specific exit rules to limit losses and protect capital.
- Market Timing: Considers overall market direction to improve success rates.
Limitations of CAN SLIM
- Momentum Dependency: Can underperform in value-oriented or defensive markets.
- Frequent Monitoring: Requires regular attention to entries, exits, and changing fundamentals.
- Potential Volatility: Growth stocks can experience sharp corrections even within uptrends.
- Limited Diversification: May concentrate in specific sectors showing the strongest growth.
- Data Requirements: Needs comprehensive and accurate financial and technical data.
Common Mistakes When Using a CAN SLIM Stock Screener
Even with a systematic approach like CAN SLIM, investors often make these critical errors:
Ignoring Market Direction
Many investors focus solely on individual stock criteria while overlooking the “M” in CANSLIM. Buying even the best stocks in a downtrending market significantly reduces success rates. Always check if major indexes are above their 200-day moving averages before initiating new positions.
Chasing Extended Stocks
Buying stocks that are already extended 20% or more beyond their proper buy points dramatically increases risk. Wait for proper bases to form and buy at the correct breakout point, not after a stock has already made a significant run.
Neglecting Volume Analysis
Volume confirms price movement. Many investors ignore this critical component when stocks break out. A proper breakout should occur on volume at least 40% higher than normal, indicating institutional accumulation.
Failing to Cut Losses
The 7-8% stop-loss rule is non-negotiable in the CAN SLIM system. Many investors hold losing positions hoping for a rebound, which can lead to catastrophic losses. Successful CAN SLIM investors strictly adhere to this rule without exception.
Overemphasizing EPS Without Checking Quality
Not all earnings growth is equal. One-time events, accounting changes, or acquisitions can inflate EPS figures. Verify that earnings growth is supported by corresponding sales growth and comes from core business operations.
“The whole secret to winning in the stock market is to lose the least amount possible when you’re not right.“
William O’Neil, Founder of Investor’s Business Daily
Actionable Tips for Refining Your CAN SLIM Stock Screener
Layer Your Screening Process
Instead of applying all CAN SLIM criteria at once (which may yield too few results), start with the most important factors (current earnings growth, relative strength) and gradually add additional filters. This allows you to see how each criterion impacts your results and adjust accordingly.
Action Step: Create a base screen with just EPS growth ≥25% and then add criteria one by one.
Create Industry-Specific Screens
Different industries have different growth characteristics. Adjust your screening parameters based on the industry—for example, use higher EPS thresholds for technology and lower ones for utilities or consumer staples.
Action Step: Develop separate CAN SLIM screens for high-growth sectors (tech, biotech) and more stable sectors (consumer, industrial).
Incorporate Earnings Surprise History
Companies that consistently beat analyst expectations often continue to do so. Add a filter for stocks that have surprised positively in the last 2-4 quarters to find companies with momentum that may not yet be fully reflected in the stock price.
Action Step: Add a filter for positive earnings surprises in at least 3 of the last 4 quarters.
Use Moving Average Filters
To better capture the “M” in CAN SLIM, add technical filters that ensure stocks are in strong uptrends. Look for stocks trading above their 50-day and 200-day moving averages, with the 50-day moving average also above the 200-day.
Action Step: Add criteria for price > 50-day MA > 200-day MA to your screener.
Monitor Institutional Accumulation Trends
Rather than just looking at the percentage of institutional ownership, track the change in institutional positions over recent quarters. Increasing institutional ownership often precedes major price moves.
Action Step: Add a filter for stocks where institutional ownership increased by at least 5% in the most recent quarter.
Pro Tip: Schedule a weekly screening session on weekends to identify new candidates and review existing holdings against your CAN SLIM criteria. Consistency is key to successful implementation.
Conclusion: Taking Action with Your CAN SLIM Stock Screener
The CANSLIM methodology has stood the test of time as a powerful approach for identifying high-growth stocks with the potential for significant price appreciation.
By systematically screening for stocks with strong fundamentals, technical strength, and institutional support—all within favorable market conditions—you can significantly improve your chances of finding tomorrow’s market leaders today.
Remember that successful implementation requires both discipline and flexibility. Stick to the core principles while adapting to changing market conditions. Most importantly, always adhere to proper risk management through position sizing and stop-loss rules.
Start Finding CANSLIM Stocks Today
Apply these principles with professional-grade screening tools and discover your next winning investment.
FAQs
How often should I run my CAN SLIM stock screener?
For best results, run your CAN SLIM screener at least weekly. Market conditions and individual stock fundamentals change constantly, and new opportunities emerge regularly. Many successful CAN SLIM investors perform their screening routine on weekends to prepare for the coming week.
Can CAN SLIM work in bear markets?
CAN SLIM is primarily designed for bull markets. During bear markets, the strategy suggests moving largely to cash (up to 75-100%) and focusing on preserving capital. However, even in bear markets, certain sectors may show relative strength and meet CAN SLIM criteria. The key is to be much more selective and maintain tighter stop-losses.
How many stocks should I hold in a CAN SLIM portfolio?
William O’Neil recommends holding between 5-8 stocks for most investors. This provides sufficient diversification while allowing you to closely monitor each position. During uncertain markets, holding fewer positions (3-5) is prudent, while in strong bull markets, you might expand to 8-10 positions.
Disclaimer: CAN SLIM® is a registered trademark of Investor’s Business Daily, LLC. This article is for educational purposes only and is not affiliated with or endorsed by Investor’s Business Daily.
Educational content only, not financial advice.Content may contain affiliate links.