
Educational content only, not financial advice.Content may contain affiliate links.
Learn how to invest in blue chip stocks with 7 metrics you can apply to your stock screener. Blue chip stocks can be a solid foundation for long-term investing, but “great company” does not automatically mean “great price.”
If your goal is to build a portfolio of durable businesses, the key is to evaluate them with consistent, measurable criteria instead of hype, brand names, or recent headlines.
This guide lays out a practical framework using seven core metrics to research blue chip stocks. It also includes common mistakes to avoid, and a research workflow you can repeat every time you add or trim a holding.
Key Takeaways
- Blue chip quality isn’t enough. Always pair quality with valuation.
- Use the 7 metrics. Before buying (or trimming).
- Revenue growth reflects demand. Growth driven by customers, not accounting noise.
- ROIC helps confirm durability. Strong returns are a signal of competitive advantage.
- Cash flow is what funds shareholder returns. It supports dividends and buybacks.
- Debt is a resilience test. Check the business can handle recessions.
- Valuation discipline protects your returns. Avoid overpaying.
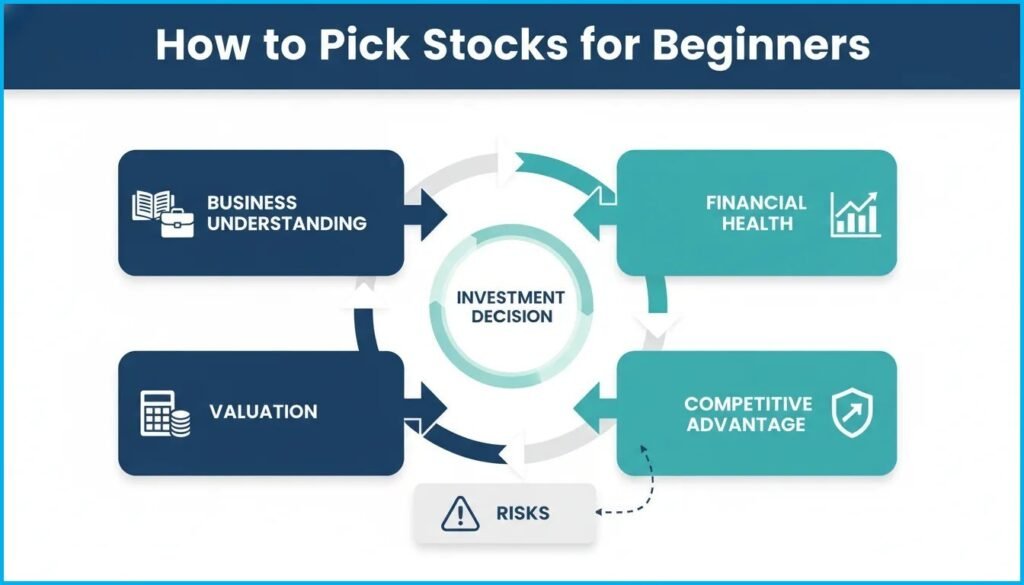
What Makes a Stock a “Blue Chip” and Why Metrics Still Matter
A classic blue chip profile generally includes qualities like long-term profitability, strong free cash flow, a solid balance sheet, and a durable competitive advantage. Many investors associate blue chips with businesses that have:
- Consistent profitability over a long period (often cited as 10+ years)
- Strong free cash flow that supports reinvestment and shareholder returns
- Strong balance sheet characteristics (or at least manageable leverage)
- Durable competitive advantage (brand, network effects, switching costs, scale)
However, blue chip status is only the starting point. The most important question for “best blue chip stock” research is whether the business still deserves a premium or is currently mispriced. That is where valuation and cash flow based metrics become crucial.
The 7 Best Metrics to Research Blue Chip Stocks Before Buying
If you want a repeatable process instead of guessing, these metrics are a strong starting point. They help you answer the same core questions every investor should ask:
Does this company have durable fundamentals, and is the stock price reasonable?
The Best Fundamental Stock Screener
All the 7 metrics mentioned can be easily found on Stock Rover including comprehensive stock analysis.
1) Revenue Growth
Look beyond earnings. Earnings can be influenced by one-time items or accounting changes. Revenue growth tends to be a clearer signal that customers are actually buying and using the product or service.
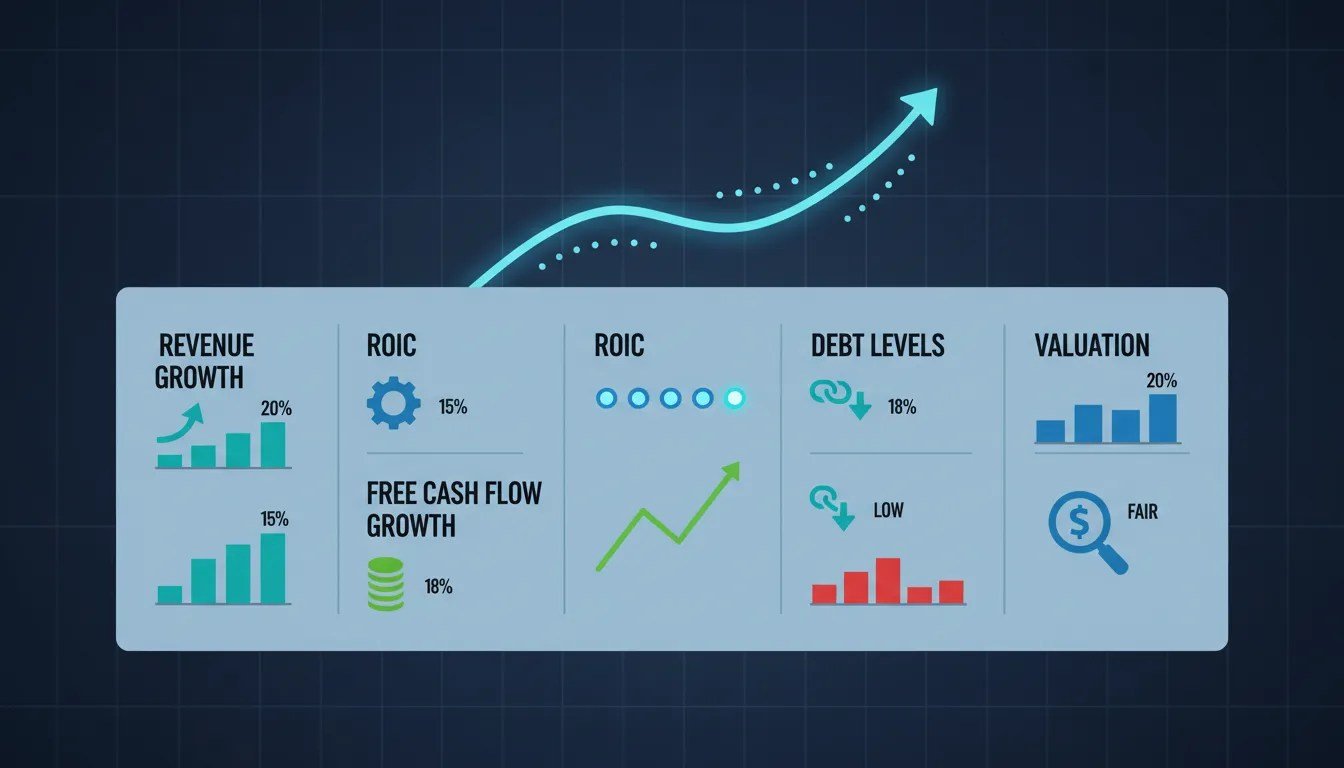
Look for a 5-year revenue CAGR (compound annual growth rate) of about 5% to 8% or higher.
- What to check: 5-year revenue compounded annual growth rate (CAGR)
- Why it matters: It indicates the business is expanding, not only cutting costs
- Quality lens: Prefer growth driven by customers and usage, not temporary adjustments
Important detail: The growth should be driven by real demand, not accounting adjustments. You’re trying to confirm the business is expanding its reach, not just improving margins one quarter at a time.
2) Return on Invested Capital (ROIC)
ROIC measures how efficiently a business turns invested capital into profits. It helps you identify companies with a competitive advantage because they can generate returns while using capital responsibly.
A common rule-of-thumb benchmark is:
- 15%+ ROIC is best
- 10% to 15% ROIC is still strong
When ROIC is consistently high, it often points to durable economics such as pricing power, network effects, or low-cost scaling.
- What to check: ROIC and whether it is sustained
- Why it matters: High ROIC can reflect competitive advantage
- Interpretation: High ROIC supported by real cash generation is especially attractive
If you want to find the “best” blue chip stocks over time, ROIC is one of the most informative metrics you can use.
3) Free Cash Flow (FCF) Growth
Profit on paper is not enough. Free cash flow is what actually funds dividends, buybacks and acquisitions.
The goal is simple: look for consistent free cash flow growth. If free cash flow is reliably rising, it suggests the underlying business is healthy and self-funding.
- What to check: Whether free cash flow is consistently rising
- Why it matters: Cash flow supports shareholder returns and reinvestment
- Red flag: Businesses that get into trouble often have cash flow problems
Most companies do not fail because of “bad headlines.” They get into trouble because cash generation breaks down. That’s why free cash flow deserves your attention.
4) Debt Levels
Even great businesses can face stress if leverage is too high. The debt metric is about resilience, especially if the economy slows or financing costs rise.
Two practical indicators to look at:
- Debt to equity ratio
- Interest coverage ratio (ability to pay interest from operating earnings)
The goal is to find companies that can survive recessions or market drawdowns without financial strain.
- What to check: debt to equity and interest coverage
- Why it matters: It helps estimate survival odds during downturns
- Practical test: Would the balance sheet be a problem in a rough year?
Debt deserves extra scrutiny in periods of high interest rates.
5) Valuation
Valuation is where many investors make mistakes. You can find a great stock and still get poor returns if you pay too much.
That is why you should evaluate valuation relative to:
- Historical averages (for the company)
- Peers or sector norms
- Expected growth (so price makes sense for the business trajectory)
Several valuation approaches are useful:
- P/E vs 5-year average (relative valuation)
- PEG ratio (P/E divided by growth rate)
- Free cash flow yield (cash-based valuation)
Valuation discipline improves odds even when the fundamentals are strong.
A key principle: Don’t overpay for even the best businesses.
6) Dividend Growth & Payout Ratio
For blue chip stocks specifically, dividends are not just a bonus — they are often a signal of financial confidence. A company that consistently raises its dividend is telling you that management expects cash flow to keep growing.
Two things to evaluate together:
- Dividend growth rate (ideally 5+ consecutive years of increases)
- Payout ratio (dividends paid as a percentage of earnings or free cash flow)
The payout ratio is the critical check. A dividend that consumes 90% of earnings is fragile. A dividend that consumes 40% to 60% leaves room for reinvestment and future raises.
- What to check: Dividend growth streak and payout ratio
- Why it matters: Rising dividends signal management confidence in future cash flows
- Red flag: A high yield with a high payout ratio can indicate a dividend at risk
Blue chip investors often rely on dividend income. Make sure the dividend is sustainable before you do.
7) Profit Margin Trends
Revenue growth matters, but margin trends tell you whether that growth is actually profitable. A company growing revenue while margins are shrinking may be buying growth at the expense of quality.
Look at two layers:
- Gross margin — reflects pricing power and cost of delivering the product
- Operating margin — reflects how efficiently the business is run overall
The most important thing is the direction of margins over time. Stable or expanding margins in a competitive industry are a meaningful sign of durability.
- What to check: Gross and operating margin trends over 5 years
- Why it matters: Expanding margins often indicate pricing power or improving efficiency
- Quality lens: Margins that hold up during economic downturns are especially telling
Strong margins are what separate businesses that merely survive competition from those that dominate it.
Match Stocks to the Macro Economic Picture

Blue chip investing does not mean every company is best at the same time. Part of choosing the right holdings is understanding which businesses tend to perform better under different macro conditions.
Here are practical ways to think about it when selecting blue chip candidates:
- If tech and AI are expected to dominate: consider businesses positioned around enterprise software, platforms, or innovation while still maintaining strong balance sheet strength.
- If volatility and higher rates are expected to persist: look for businesses with strong cash generation and diversified revenue that can maintain stability.
- If recession resilience matters most: consider defensive companies with stable demand that tends to hold up across economic cycles.
The important part is that economic views influence which types of blue chips you prioritize. Your five metrics still determine whether each specific stock is attractive.
This is not about predicting the future perfectly. It’s about making sure you understand the “why” behind each holding. If your thesis is clear, you can handle inevitable dips without panic-selling.
How To Decide Which Blue Chip Stocks to Buy or Trim?
Use clear decision rules:
- For new buys: prioritize companies scoring well on revenue growth quality, sustained ROIC, rising free cash flow, manageable debt, and valuation that looks reasonable versus history and growth expectations.
- For hold decisions: confirm the original company thesis still matches what you see in cash flow, ROIC, and valuation. If any of these break the story, reconsider.
- For trims: if you no longer believe the business can keep its advantage over a long horizon, reduce exposure instead of letting a position stagnate.
Finally, remember that investing carries risk. No metric guarantees returns. The goal is to make decisions with evidence, not emotion.
Bottom Line: How to Invest in Blue Chip Stocks
Blue chips can be amazing, but “amazing” is not enough. The goal is to find a company with:
- Durability (tested resilience)
- Growth (real demand and expanding markets)
- Cash (free cash flow that keeps funding shareholder returns)
- Financial safety (debt that won’t choke you in recessions)
- Valuation discipline (you are not overpaying for the story)
If you apply the 7 metrics above, you’ll stop guessing and start building a portfolio you can explain. That is where confidence comes from, and it’s what helps investors actually stay in the game.
Also all the 7 metrics mentioned are available in all good stock screeners.
Find The Best Blue Chip Stocks
Apply these principles with professional-grade screening tools and discover your next winning investment.
Quick note: All investing carries risk. This is for educational purposes, not financial advice.