Learn how to use VWAP to improve your trading. This guide will walk you through the VWAP indicator step-by-step.
You’ll learn how to add VWAP to your charts, what it measures, the key settings and customization options, along with practical strategies and pitfalls so you can start applying the indicator confidently.
This tutorial is adapted from a TradingView walkthrough and written in a practical, trader-friendly way, so you can follow along and apply the lessons as you chart.
What is the VWAP Indicator?
The VWAP indicator stands for Volume Weighted Average Price. At its core, it calculates the average price of a security throughout a specified period, but with a crucial twist: the average price is weighted by volume.
We used Tradingview for this example. But you could also use TrendSpider.
Unlike a simple moving average that treats every bar equally, VWAP gives more weight to price levels where heavier volume occurred, than prices with little volume.
For example, a large green volume bar representing significant buying activity will have a far bigger influence on the VWAP line than smaller volume bars representing less trading activity.
In short, VWAP gives you a volume-informed “fair price” reference for the chosen calculation period.
That difference is the core reason many traders, especially institutional traders, include VWAP in their decision-making.
It’s especially useful in intraday trading, where volume patterns can reveal shifts in supply and demand dynamics.
How to Use VWAP: Adding it to your chart (step-by-step)
Getting started is simple. On TradingView (or a similar charting platform), open the Indicators menu and type “VWAP.”
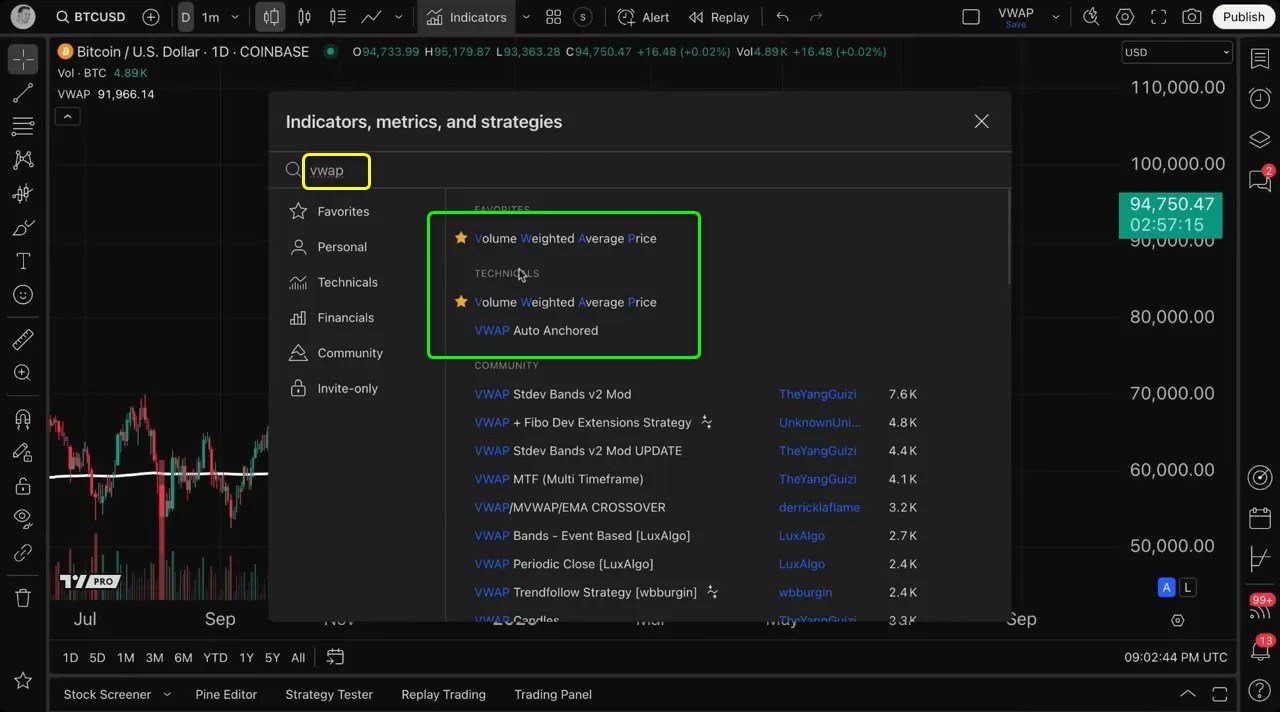
Select the VWAP indicator and it will add a line to your chart immediately.
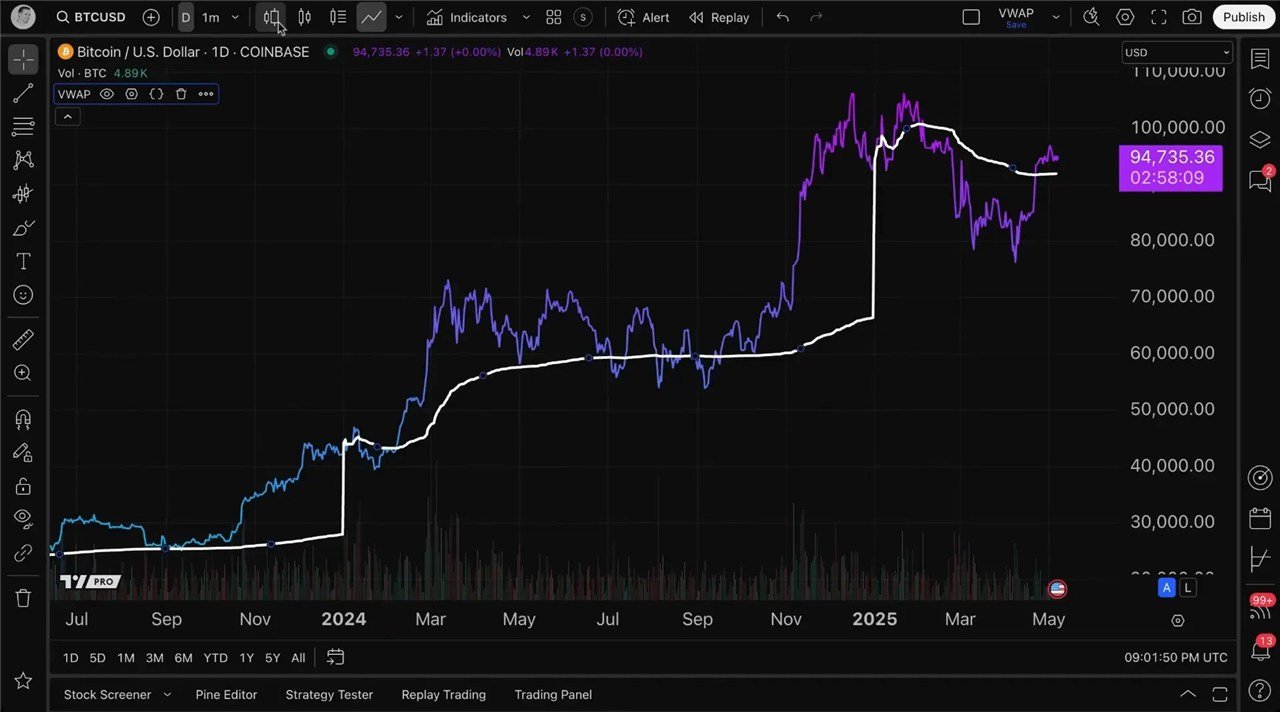
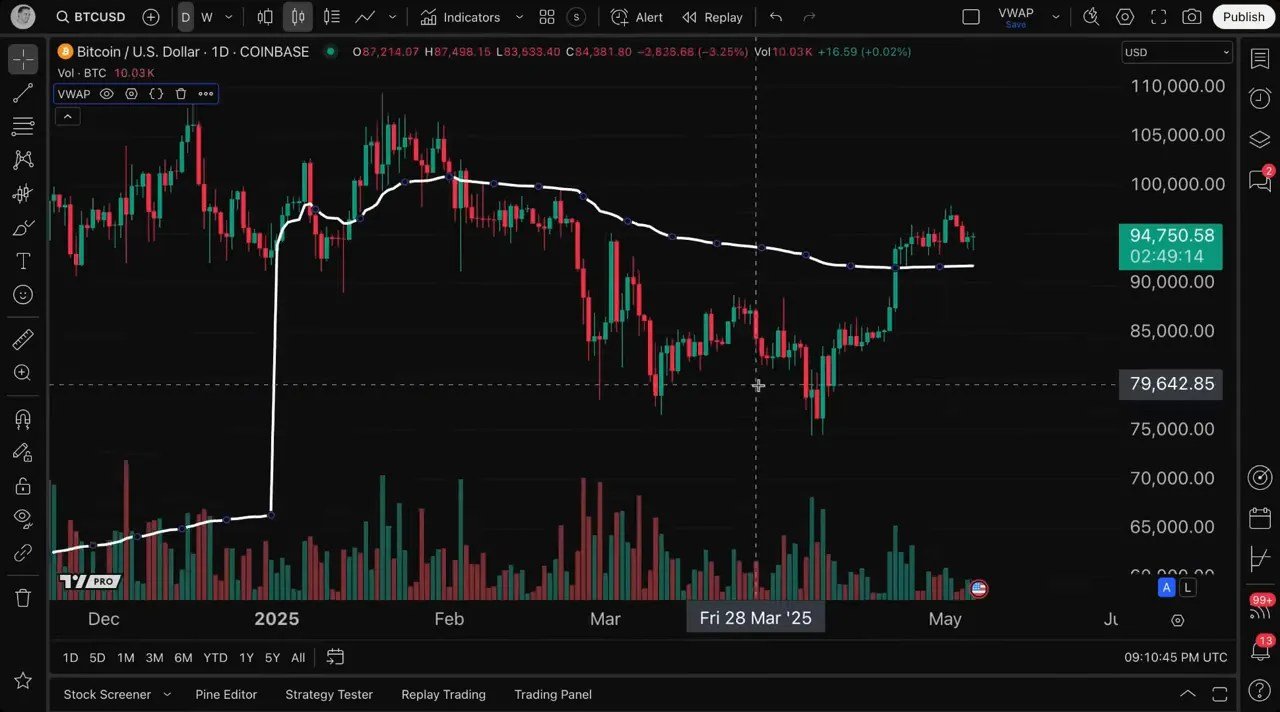
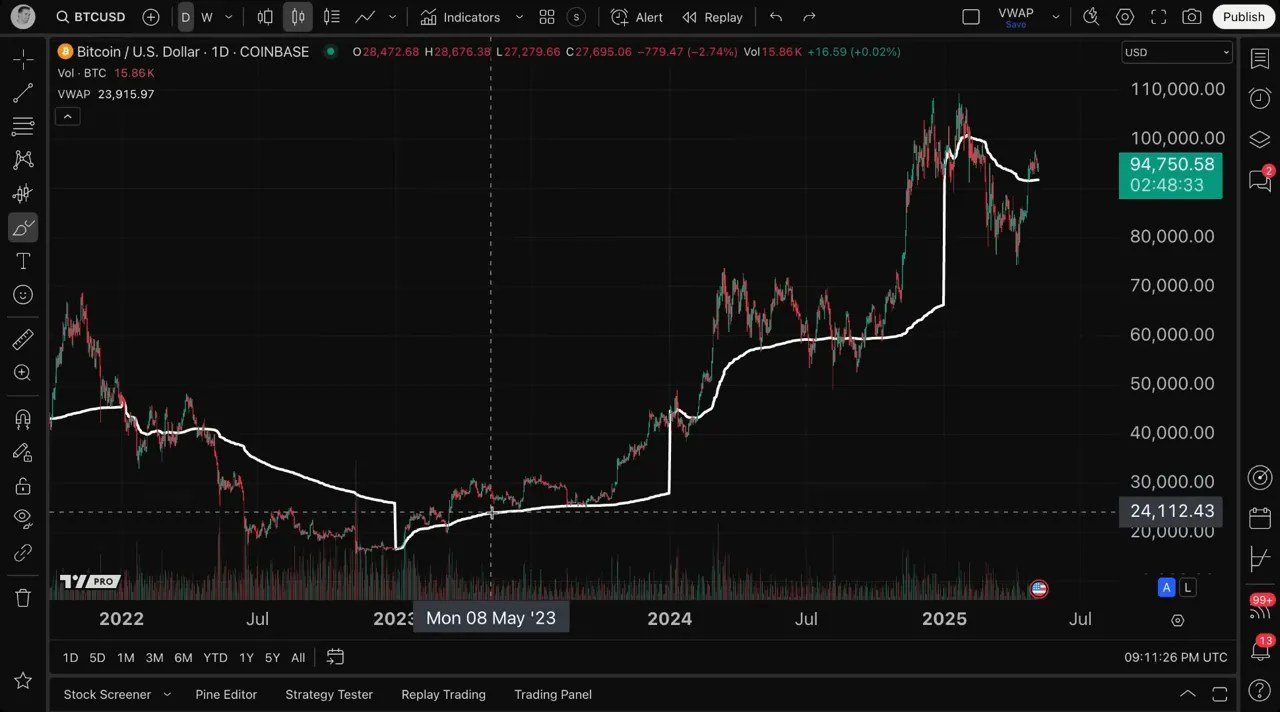
In my example I loaded VWAP on a BTCUSD daily chart; the white VWAP line sits alongside the candlesticks and reacts over time as price and volume change.
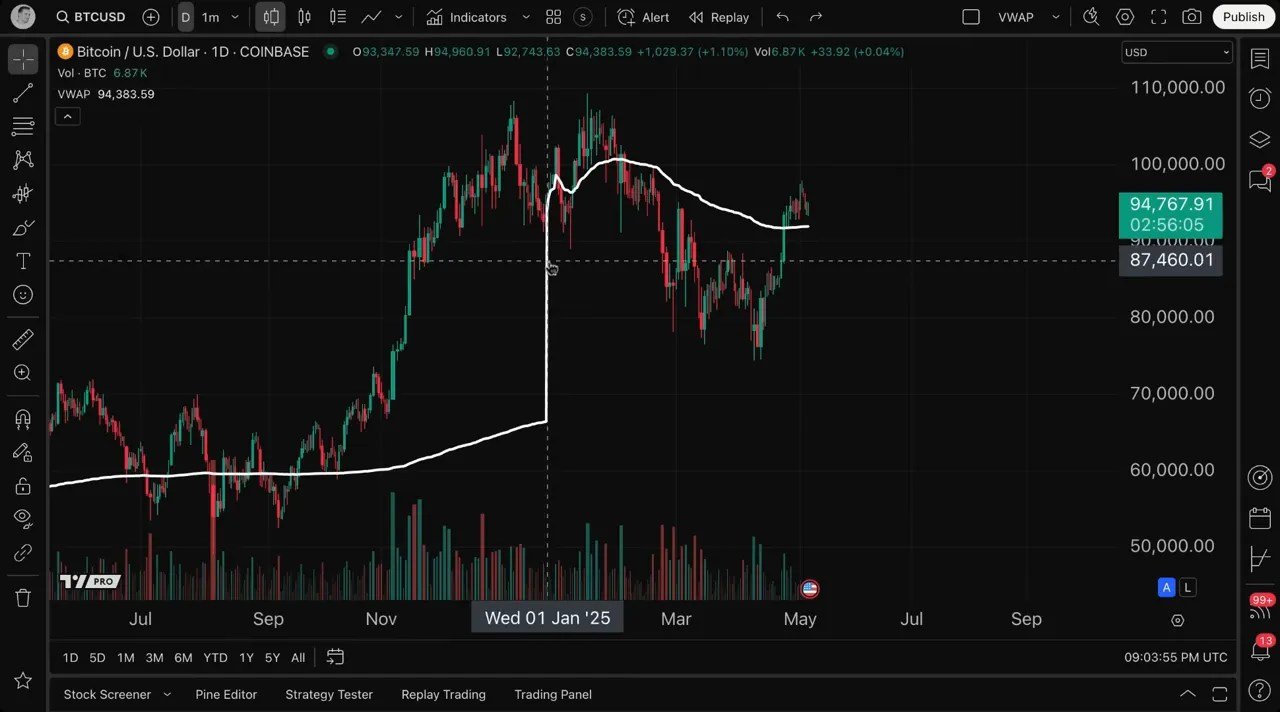
Once added, the VWAP indicator appears as a white line by default, but you have full control over its appearance and settings.
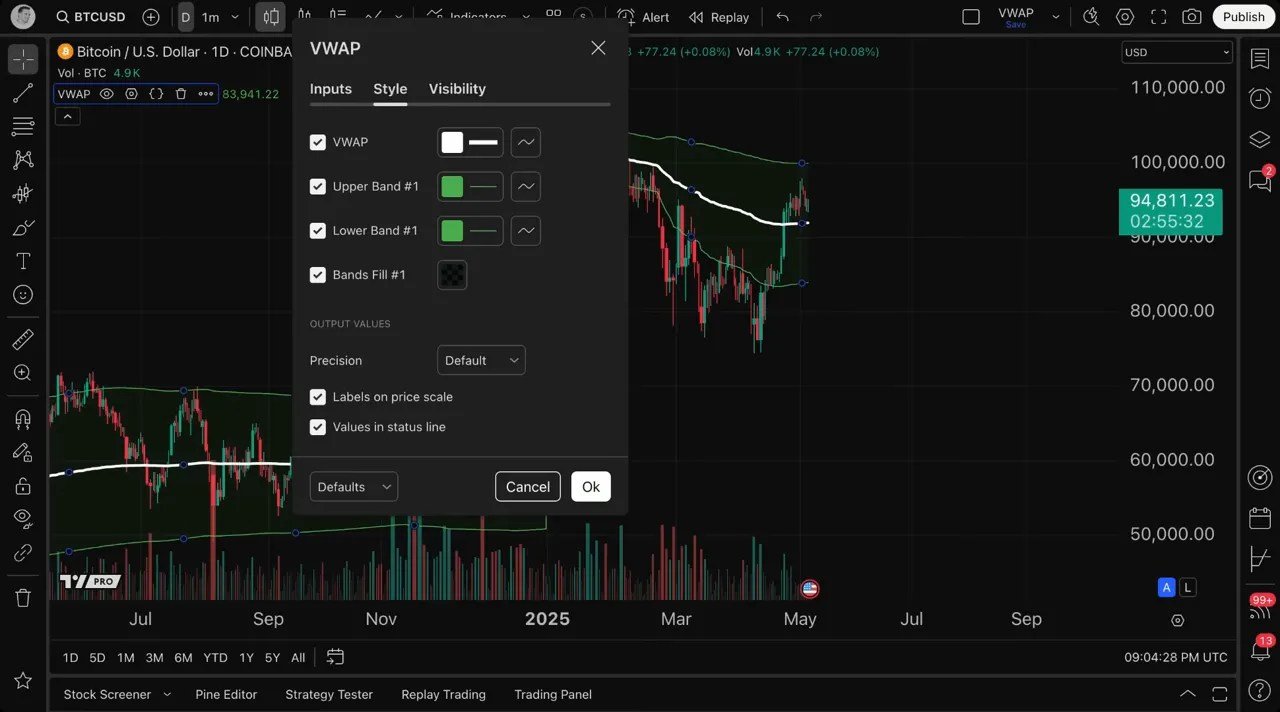
Click the settings (gear) icon to customize inputs and style.
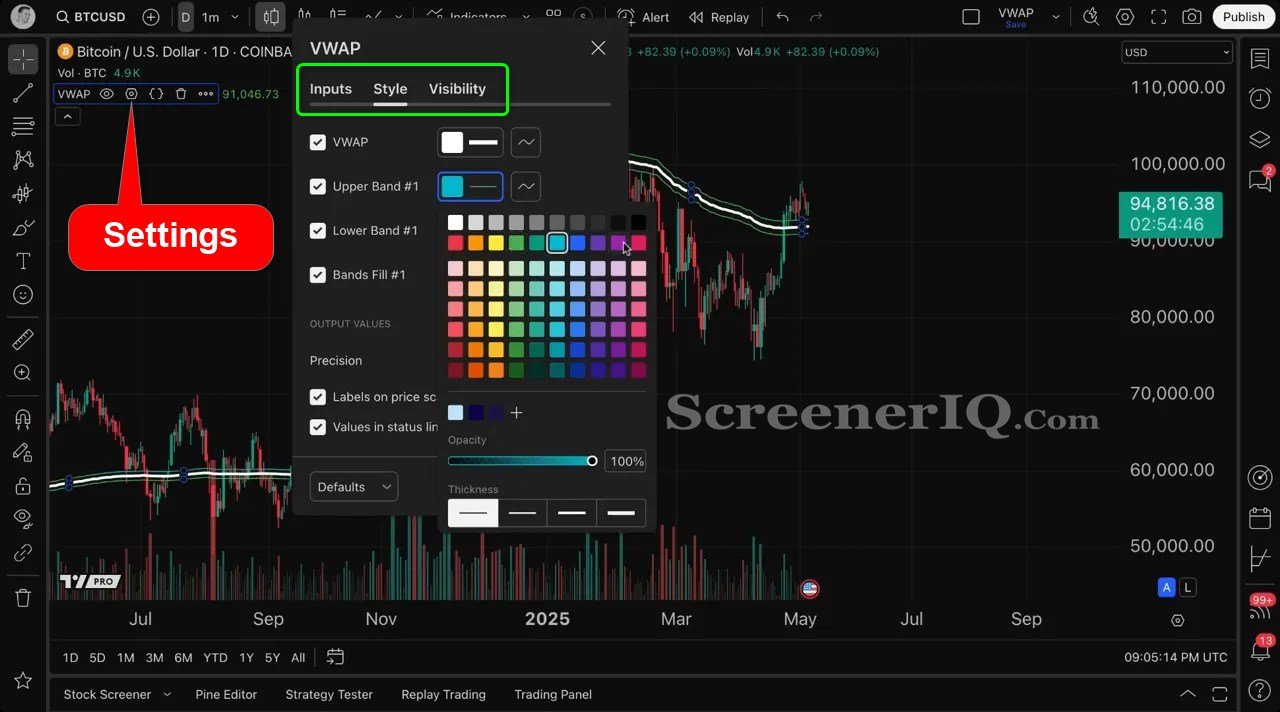
Let’s break down the customization options you’ll find:
- Inputs: Here you can select the anchor period, source price, bands multiplier, and calculation time frame.
- Style: This section allows you to change the color, line thickness, and visibility of the VWAP line and its associated bands.
We’ll cover the critical settings below so you can choose the combination that suits your trading horizon and questions.
Choosing The VWAP Source Price
Another important customization is the source price used for the VWAP calculation.
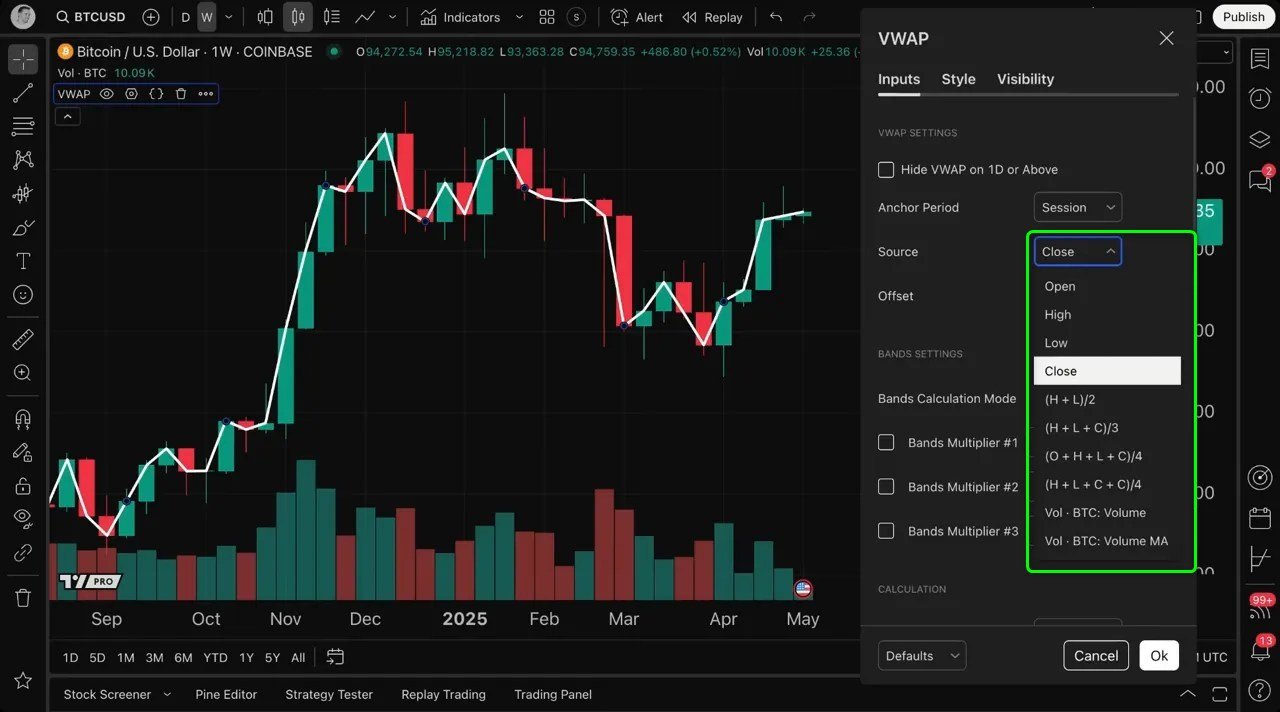
By default, the VWAP uses the closing price of each bar, but you can select other price points such as:
- Close
- Open
- High
- Low
- Typical price (HL2), or HLC3, or other averages
Each choice slightly changes the VWAP line. For example, HL2 (high+low/2) smooths some intraday noise and is often used when you want a center-of-range perspective rather than using the candle close only.
The important thing is to be consistent in your approach and understand why you picked a particular source for your strategy.
Understanding VWAP’s calculation options
One of the most common questions is: how exactly is VWAP calculated and what parts can I change? There are three primary pieces to understand that determine the shape and usefulness of the VWAP line:
- Source (price selection) — You can calculate VWAP using the open, high, low, close, typical price (HL2), or other price definitions. This choice slightly changes the line because it changes the price input for each bar.
- Anchor period — This decides when the VWAP calculation restarts. Common anchors include session, day, week, month, year, or a custom anchor. Anchoring is powerful because it lets you view intraday VWAPs or longer-period VWAPs depending on the anchor.
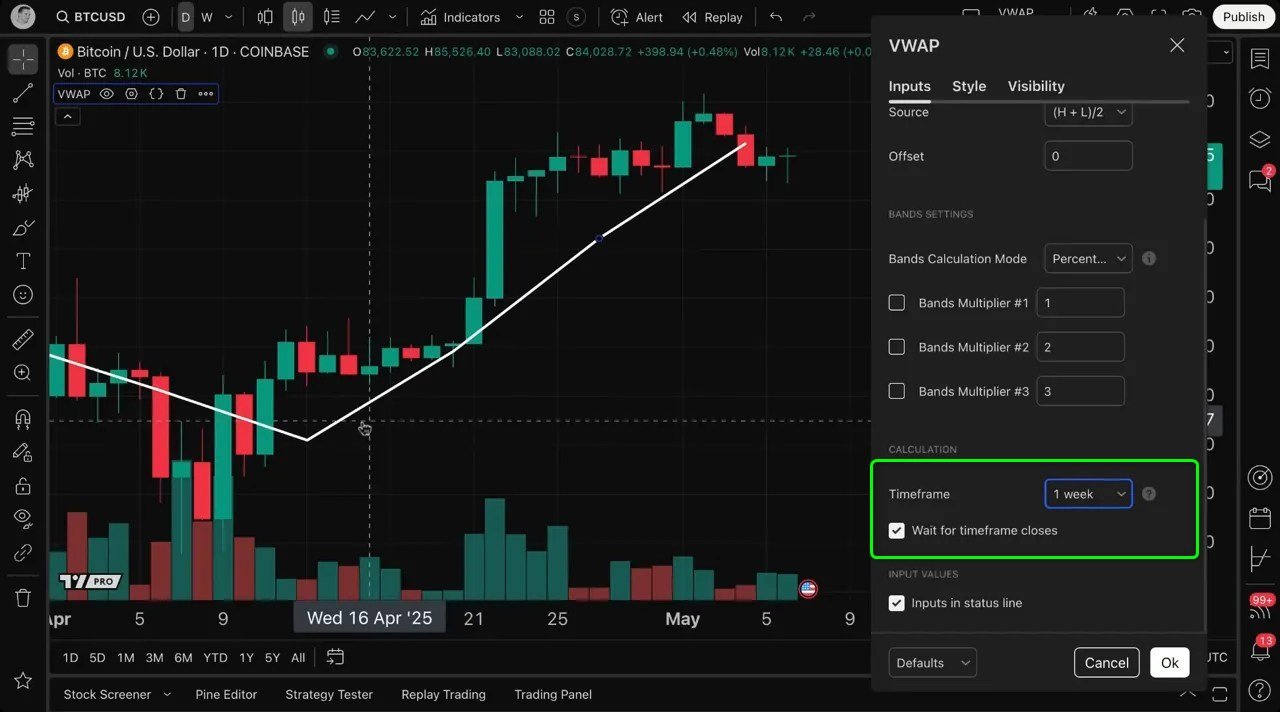
- Time frame for calculation — This lets you perform multiple time frame analysis (e.g., plot a weekly VWAP on a daily chart). You can set the VWAP to use the chart timeframe or force it to use another timeframe for the calculation.
These three settings are the backbone of how VWAP will behave on your chart. Understanding and combining them gives you powerful visibility into where market participants are concentrating activity across different windows.
How to Use VWAP Bands
By default many VWAP tools include bands around the central VWAP line.
On TradingView, these are activated as band multipliers in the indicator settings and can be specified either as standard deviations or as percentage offsets.
The bands act like a volatility envelope around VWAP: they mark areas that are one, two, or three deviations (or percent levels) away from the VWAP.
Traders use the bands the same way they use Bollinger Bands or other volatility envelopes, to visualize when price is stretched relative to the volume-weighted mean.
Common band uses:
- Spot mean reversion opportunities: price extended beyond an outer band might revert toward the VWAP.
- Confirm momentum: price moving and closing consistently beyond a band can indicate strong directional conviction.
- Define dynamic targets or stops: bands can help you set context-aware risk and profit targets.
Remember you can style these bands (color, thickness, fill) or turn them off completely if you prefer to focus only on the core VWAP line.
VWAP Anchor Period Explained
The anchor period is a fundamental setting in the VWAP indicator that determines the timeframe over which the VWAP is calculated before it resets. This concept is crucial to grasp because it changes how the VWAP line behaves on your chart.
By default, the anchor period is set to session. This means that the VWAP resets at the start of each trading session. For example, daily sessions on a daily chart, so the VWAP line you see reflects the volume-weighted average price for that specific day or session.
Choosing the right anchor period is crucial to learning how to use VWAP for your trading.
Here’s what each common anchor period represents and when you might use it:
- Session (intraday) — On intraday charts (1m, 5m, 15m), the session anchor restarts VWAP at the start of each trading session. This is the classic institutional intraday VWAP used to measure intraday execution and benchmark intraday prices.
- Day — On a daily chart, anchoring by session effectively plots a daily VWAP value that restarts each day. Good for comparing daily execution-weighted averages.
- Week — Weekly anchoring resets the VWAP at the start of each week. Use this when you want a smoother line that represents weekly volume-weighted price behavior.
- Month/Year — Long-term anchors like month or year are useful for macro-level reference. They let you compare whole-period VWAPs and spot where longer-term trading interest has clustered.
- Custom anchors (event-based) — You can anchor VWAP to important events: earnings dates, major news events, product launches, etc. Resetting VWAP at those points helps you see how market consensus evolved after the event.
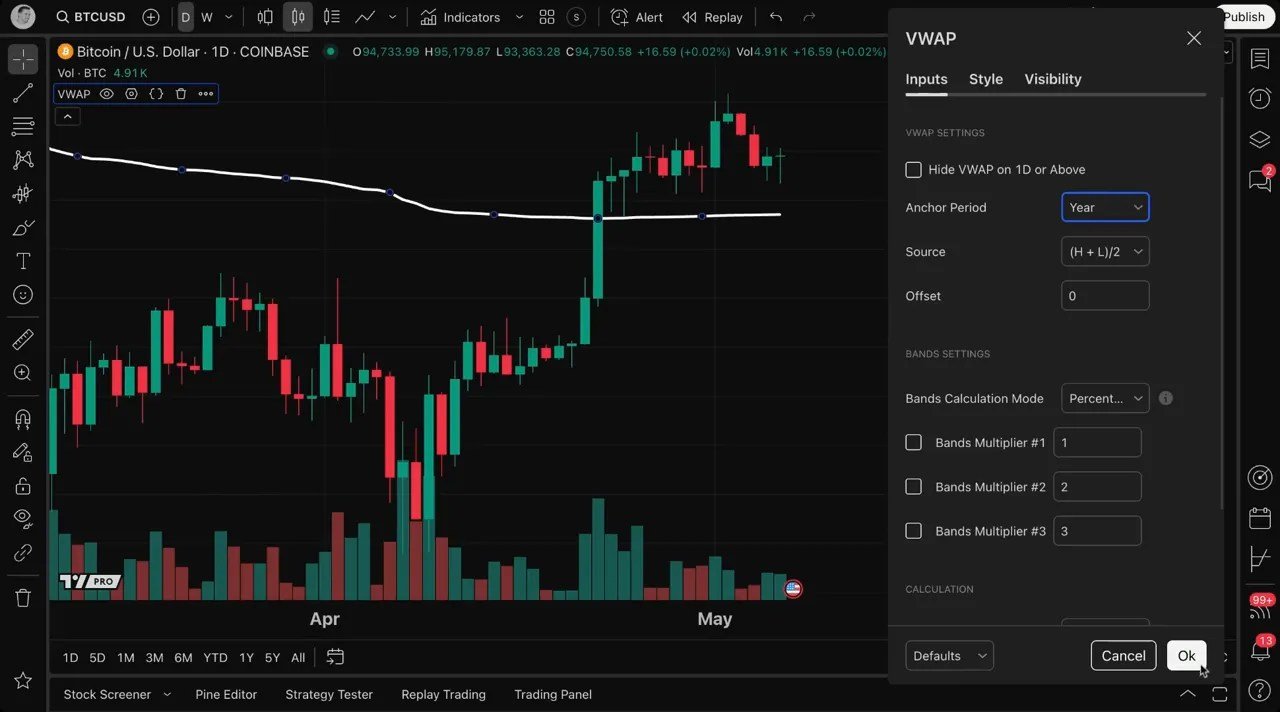
When the anchor period is changed from session to year on the BTCUSD daily chart, the VWAP line dramatically adjusted because the calculation restarted at the start of each year.
You can quickly compare the VWAP to previous time periods by toggling the anchor period like this. A great tool for seeing how the volume-weighted market price evolved year-over-year.
How to Use VWAP For Multiple Time Frame Analysis
One of the most powerful ways of how to use VWAP is its ability to perform multiple time frame analysis. This means you can apply VWAP calculations from one timeframe while viewing a different timeframe on your chart.
On TradingView you can set the VWAP’s time frame independently of your chart interval.
That means you can run a weekly VWAP overlay while viewing a daily chart, or plot a daily VWAP on a 1-hour chart.
This opens a range of analytical possibilities:
- Plot a weekly VWAP on a daily chart to see the weekly “fair price” while trading daily moves.
- Plot a monthly VWAP on an intraday chart to see where big-picture participation sits relative to intraday price action.
- Compare intraday session VWAP to a daily VWAP to spot when intraday price is diverging from daily volume-weighted averages.
Using multiple time frame VWAPs simultaneously helps you answer layered questions: Where is intraday price relative to the weekly VWAP? Is current momentum pushing price away from multi-day participation zones? Are higher timeframes acting as support or resistance on lower timeframes.
Answering these questions improves trade context and decision-making. It also helps you combine short-term and long-term perspectives seamlessly in your analysis.
How Traders Typically use VWAP in Strategies
VWAP is used across timeframes and asset classes. Below are common, practical ways traders use VWAP. These examples show how to use VWAP for entries, exits, and risk management.
Let’s explore some practical ways traders use VWAP in real-world trading scenarios:
1. Intraday Trend Identification
VWAP is widely used by day traders to identify the prevailing intraday trend. When the price is above the VWAP line, it generally indicates bullish sentiment, suggesting buyers dominate the market.
Conversely, when the price is below VWAP, it signals bearish sentiment.
Traders often use VWAP as a dynamic support or resistance level during the trading session, entering long positions near the VWAP in an uptrend or short positions near it in a downtrend. Combining VWAP slope with price action and volume can give high-quality confirmations.
2. Optimal Entry and Exit Points
Since VWAP reflects the average price weighted by volume, it helps traders pinpoint better entry and exit points aligned with market consensus. Buying near VWAP during an uptrend or selling near VWAP during a downtrend can improve trade timing and risk management.
3. Confirmation of Breakouts and Reversals
Volume is a key factor in validating price breakouts or reversals. VWAP’s incorporation of volume allows traders to distinguish between genuine moves supported by strong volume and false breakouts lacking volume confirmation.
A clean break and close above a well-respected VWAP with expanding volume, can indicate a momentum breakout.
4. Institutional Trading Benchmark
Institutional traders and algorithms often use VWAP as a benchmark to execute large orders without causing excessive market impact.
Buying below intraday VWAP is considered “good” execution (below the volume-weighted average price); selling above VWAP is considered “good” execution for sellers.
Retail traders can benefit from understanding VWAP levels where institutions might be active.
5. Mean Reversion
VWAP often acts as an attractor. Price moving far from VWAP (beyond outer bands) may revert, while VWAP can act as dynamic support/resistance. Traders often enter fading trades when price rallies above outer bands and shows signs of failure, targeting a return to VWAP.
6. Multiple-VWAP Confluence
Overlaying session VWAP, daily VWAP, and weekly VWAP can reveal confluence zones where multiple VWAPs cluster — powerful areas for entries or targets. Confluence implies many market participants across timeframes found those price ranges attractive.
Practical Steps: How to use VWAP in Your Daily Routine
- Decide your primary trading horizon (intraday, swing, position).
- Choose the VWAP anchor that matches that horizon (session for intraday, day/week/month for swing and position).
- Decide whether you want multiple VWAP overlays from different time frames for context.
- Pick a consistent price source (close, HL2, etc.).
- Add bands only if you’ll use them for entries/exits or visualization; otherwise keep VWAP simple.
- Watch how price interacts with VWAP and bands across timeframes to develop a library of examples for your trading plan.
By following these steps repeatedly, you’ll develop an intuition for how price respects or rejects VWAP and will be able to make quicker, more confident decisions when opportunities appear.
Common Pitfalls And How to Avoid Them
Understanding how to use VWAP also means understanding its limitations. Here are common mistakes and practical fixes:
- Blind reliance: VWAP is a tool, not a magic bullet. Always combine it with price action, volume, and a clear risk plan.
- Mismatched anchors and timeframe: If you place a weekly VWAP on a 1-minute trading plan without intent, it may create distracting noise. Make sure anchors serve your analysis.
- Overfitting bands: Too many bands or confusing aesthetics can dilute signal clarity. Use bands only when they add meaningful context.
- Ignoring the volume component: Remember VWAP’s power comes from volume weighting. Low-volume periods can make the VWAP less robust.
- Switching settings mid-analysis: Keep settings consistent for a given strategy; frequent changes make it hard to build meaningful edge.
Real Examples: Interpreting VWAP Behavior
Here are two concise, real-world interpretations you can apply right now:
- VWAP as dynamic support: Price pulls back into VWAP on rising volume and then bounces. This is often a low-risk entry since VWAP represents a fair price backed by trade volume.
- VWAP rejection on heavy volume: Price rallies above VWAP but gets sold back below it with a big volume spike. This suggests distribution and can be a short signal if other conditions align.
Advanced Tip: Anchor to Events
A useful advanced technique is to anchor VWAP to a specific event: for example, the start of a major earnings release, a central bank announcement, or a product launch. Resetting VWAP at an event gives you a post-event volume-weighted reference, which is extremely valuable for measuring how the market digested new information.
Event-based VWAP is particularly useful for swing traders looking to gauge whether interest in a security materially shifted after the event.
How to Use VWAP With Other Indicators
VWAP integrates nicely with many other tools. A few common pairings that work well include:
- VWAP + Moving Averages: Use moving averages to capture momentum while VWAP captures volume-weighted value. Crosses between MA and VWAP can add confirmation.
- VWAP + RSI or MACD: Use oscillators to detect divergence or momentum exhaustion while VWAP provides a price reference.
- VWAP + Volume Profile: Volume Profile identifies where volume concentrated across price over a longer period; VWAP gives a running average anchored to time and can be used for short-term execution decisions.
Conclusion
Learning How to use VWAP is a high-value skill for any trader. VWAP is straightforward in concept, a volume-weighted average price, but flexible in application.
By understanding anchors, price sources, bands, and how to overlay different VWAPs across timeframes, you gain a market-aware reference that complements price action and volume analysis.
Thanks to TradingView for the walkthrough that inspired this guide. If you want hands-on practice, load VWAP on your chart, try different anchor periods, and keep a journal of how price interacts with the indicator. With practice, you’ll be able to discover how to use VWAP for your own trading style.
We used Tradingview for this example. But you could also use TrendSpider.
FAQs
Is VWAP only for intraday traders?
No. While institutional traders often use intraday session VWAP, VWAP can be anchored to longer periods (week, month, year) and used by swing and position traders. The key is choosing an anchor that matches your time horizon.
Should I use VWAP bands?
Bands are useful but optional. They help visualize volatility relative to the VWAP and can be used to identify stretched conditions. Use them if they add value to your signals.
Which price source should I use?
There is no universally best source. The close is common; HL2 (high+low/2) offers a center-of-range perspective. Choose one and be consistent for your strategy.
Can VWAP be used as a stop-loss or target?
Yes. Many traders use VWAP or its bands as dynamic targets and stops because they reflect collective volume-based market interest.
Educational content only, not financial advice.Content may contain affiliate links.