
The Tradingview ETF Screener is designed to be a powerful tool, helping investors and traders discover, analyze, and evaluate ETFs across the globe.
Whether you’re a beginner dipping your toes into ETF investing, or a seasoned trader looking for precision and speed, this simple guide will walk you through everything you need to know about using the TradingView ETF Screener effectively.
Introduction to the TradingView ETF Screener
The ETF Screener on TradingView is a dynamic, feature-rich platform that allows users to sort, filter, and dive deep into ETFs from all over the world. Covering various asset classes, this innovative tool lets you customize your search with precision, enabling you to find ETFs that best fit your strategy and preferences.
One of the key benefits of the TradingView ETF Screener is its ability to save customized screens for future use and export data for offline analysis. This flexibility means you can create multiple ETF screens tailored for different investment themes or strategies and switch between them effortlessly.
Getting Started: Accessing the ETF Screener
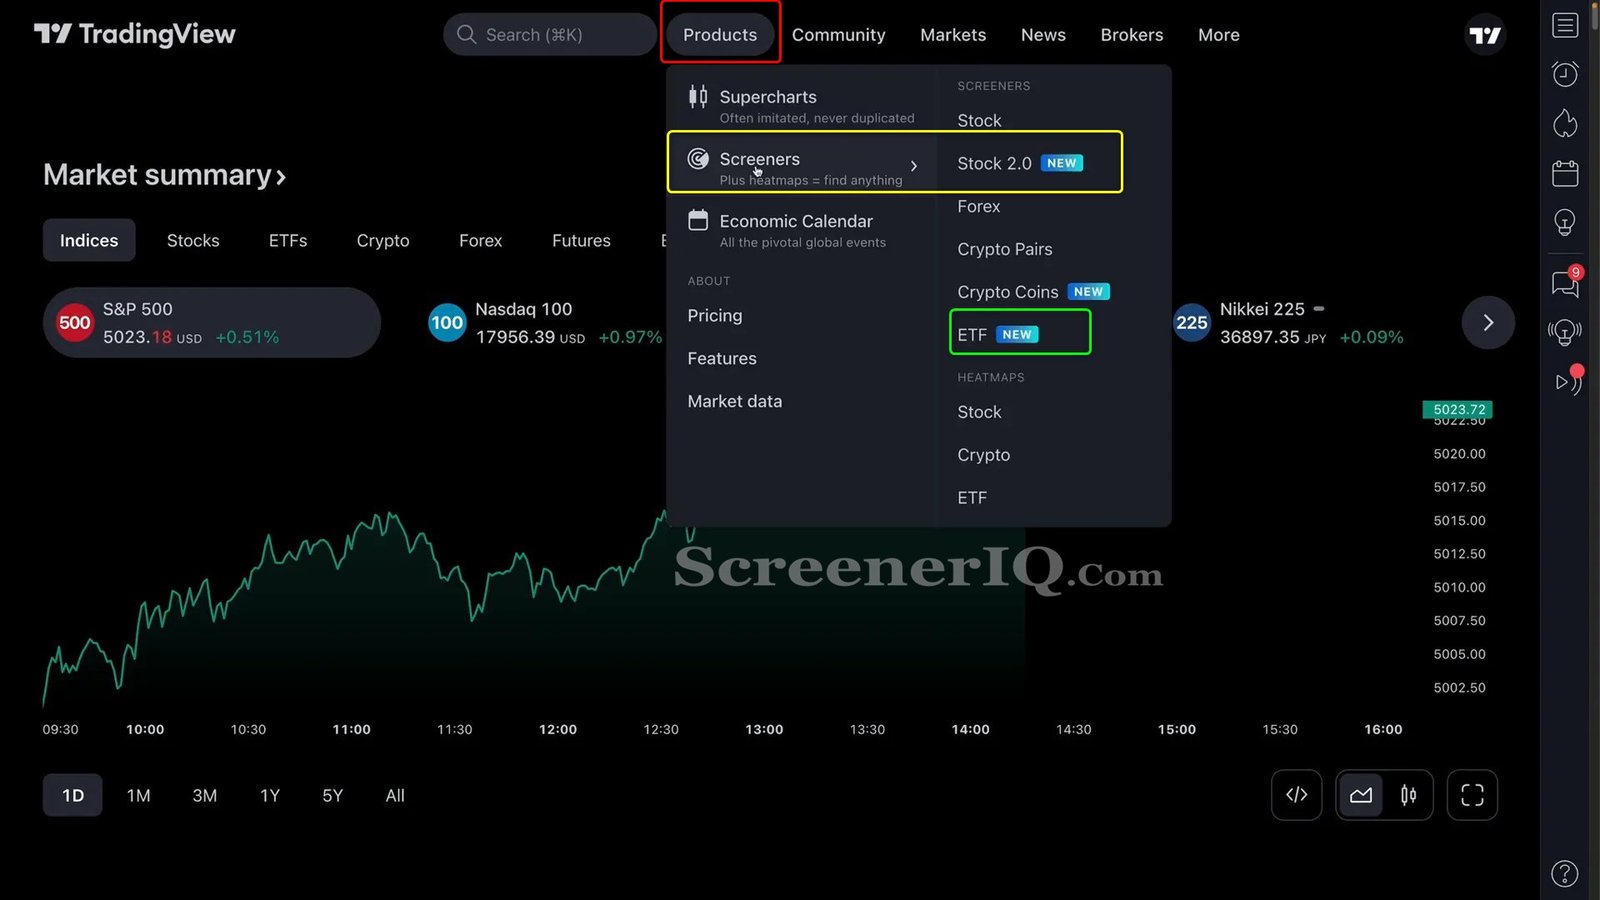
To begin using the ETF Screener, navigate to TradingView.
From the homepage:
- Hover over the Products menu at the top.
- Scroll down to Screeners and select ETF.
- Click to open the ETF Screener tool.
Upon launching, the ETF Screener interface will appear, ready for you to start filtering and sorting ETFs based on your criteria.
Click to enlarge images.
Understanding the Interface: Top-Level Filters and Options
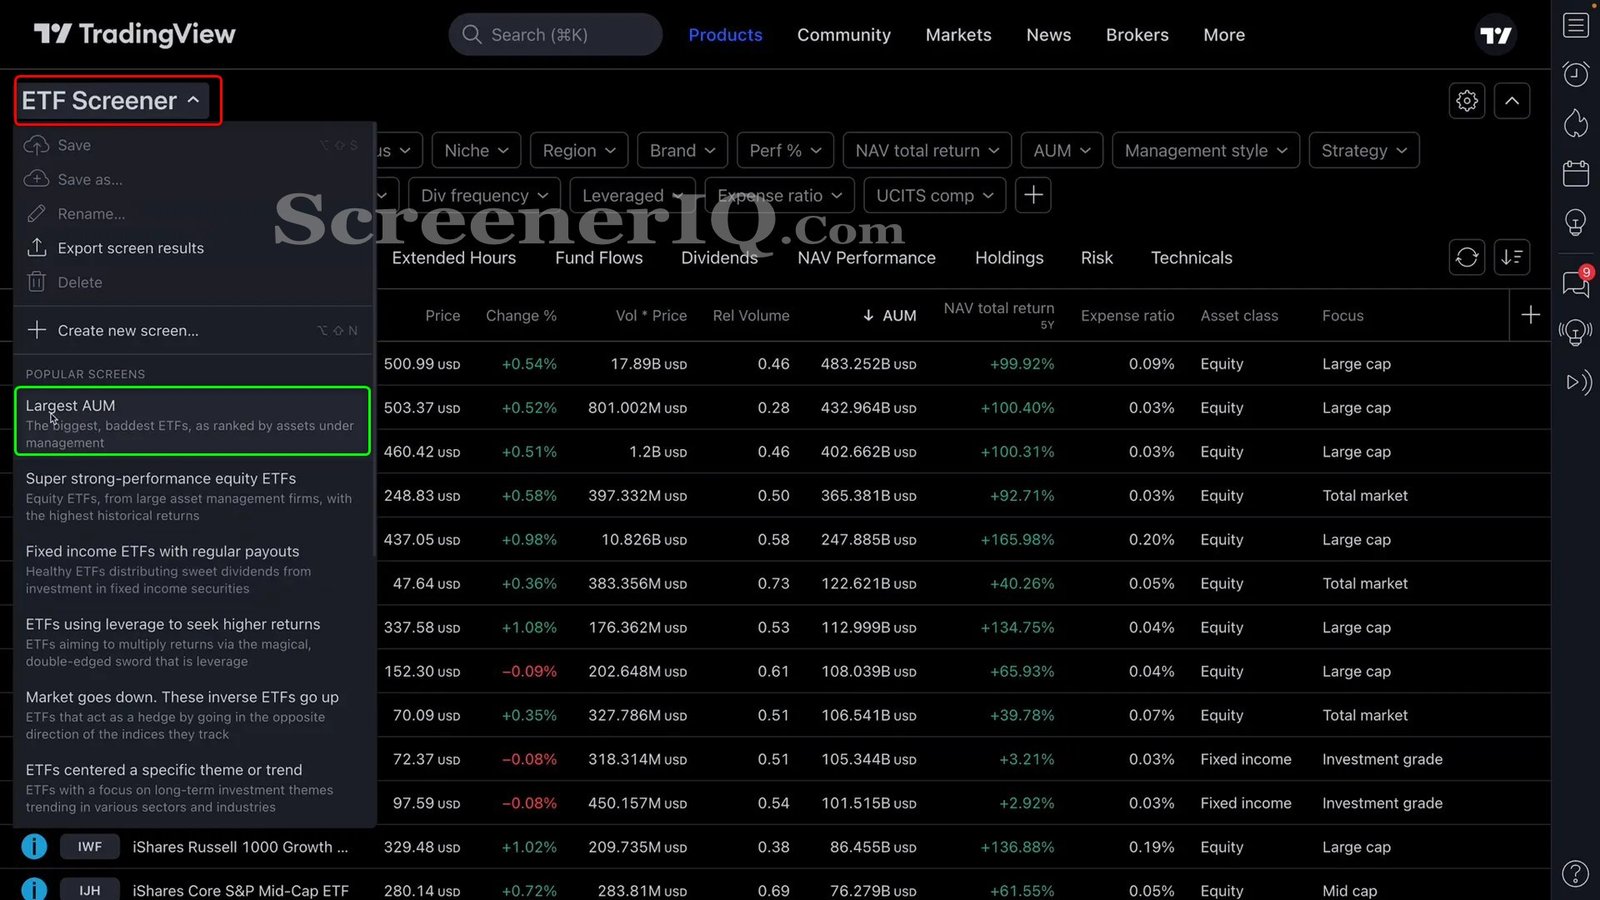
At the top of the ETF Screener, you’ll find a drop-down menu that houses many of the key filtering options. This is where you begin crafting your custom screen. Here’s a quick overview of its main features:
- Save Button: After setting up your filters, you can save your screen to your TradingView account. This makes it easy to revisit or adjust your screen anytime.
- Export Results: Export your filtered ETF list for offline analysis or record-keeping.
- Create New Screen: Build multiple screens for different ETF themes, such as dividend-focused ETFs or broad market ETFs, and switch among them with ease.
- Popular Screens: Access pre-built popular screens like “Largest AUM” (Assets Under Management) with a single click, giving you a great starting point.
Let’s start with the popular “Largest AUM” screen. Selecting this filter focuses on ETFs with assets under management greater than 1 billion in the US market, giving you a robust list of 722 ETFs to explore.
Filtering ETFs: Narrowing Down by Asset Class and Other Metrics
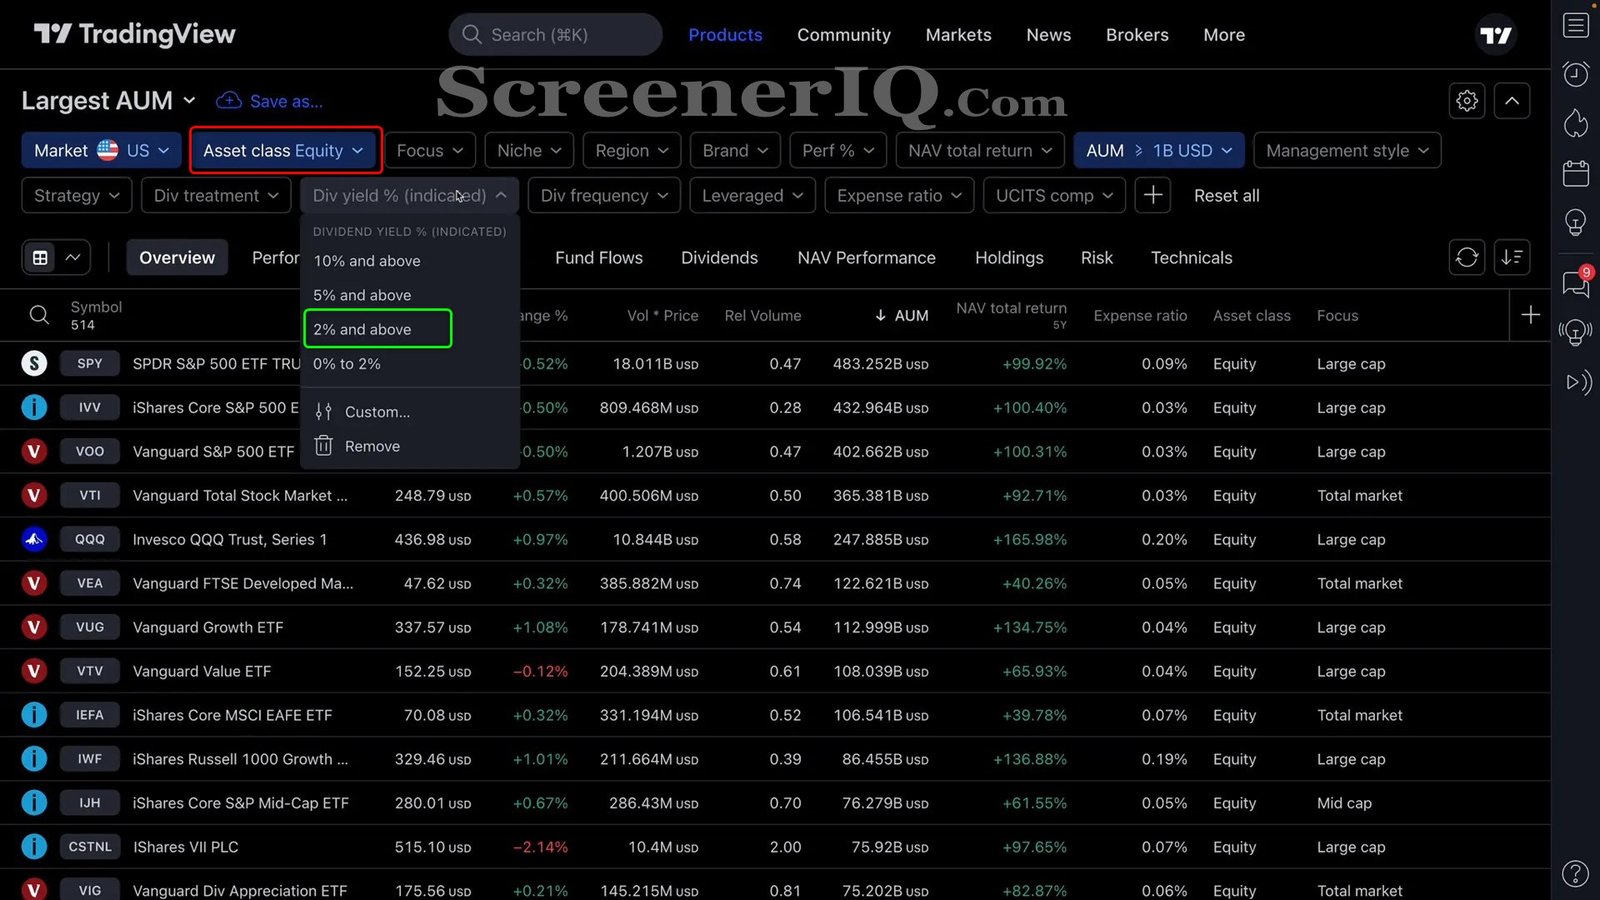
Once you have a broad list, the next step is refining your search. For example, you might want to focus only on Equity ETFs (funds that invest in stocks). By selecting “Equity” under the asset class filter, the list narrows from 722 ETFs to 514.
To get even more specific, consider adding a dividend yield filter. If you want ETFs that pay a dividend yield above 2%, applying this filter reduces the number of ETFs to 190.
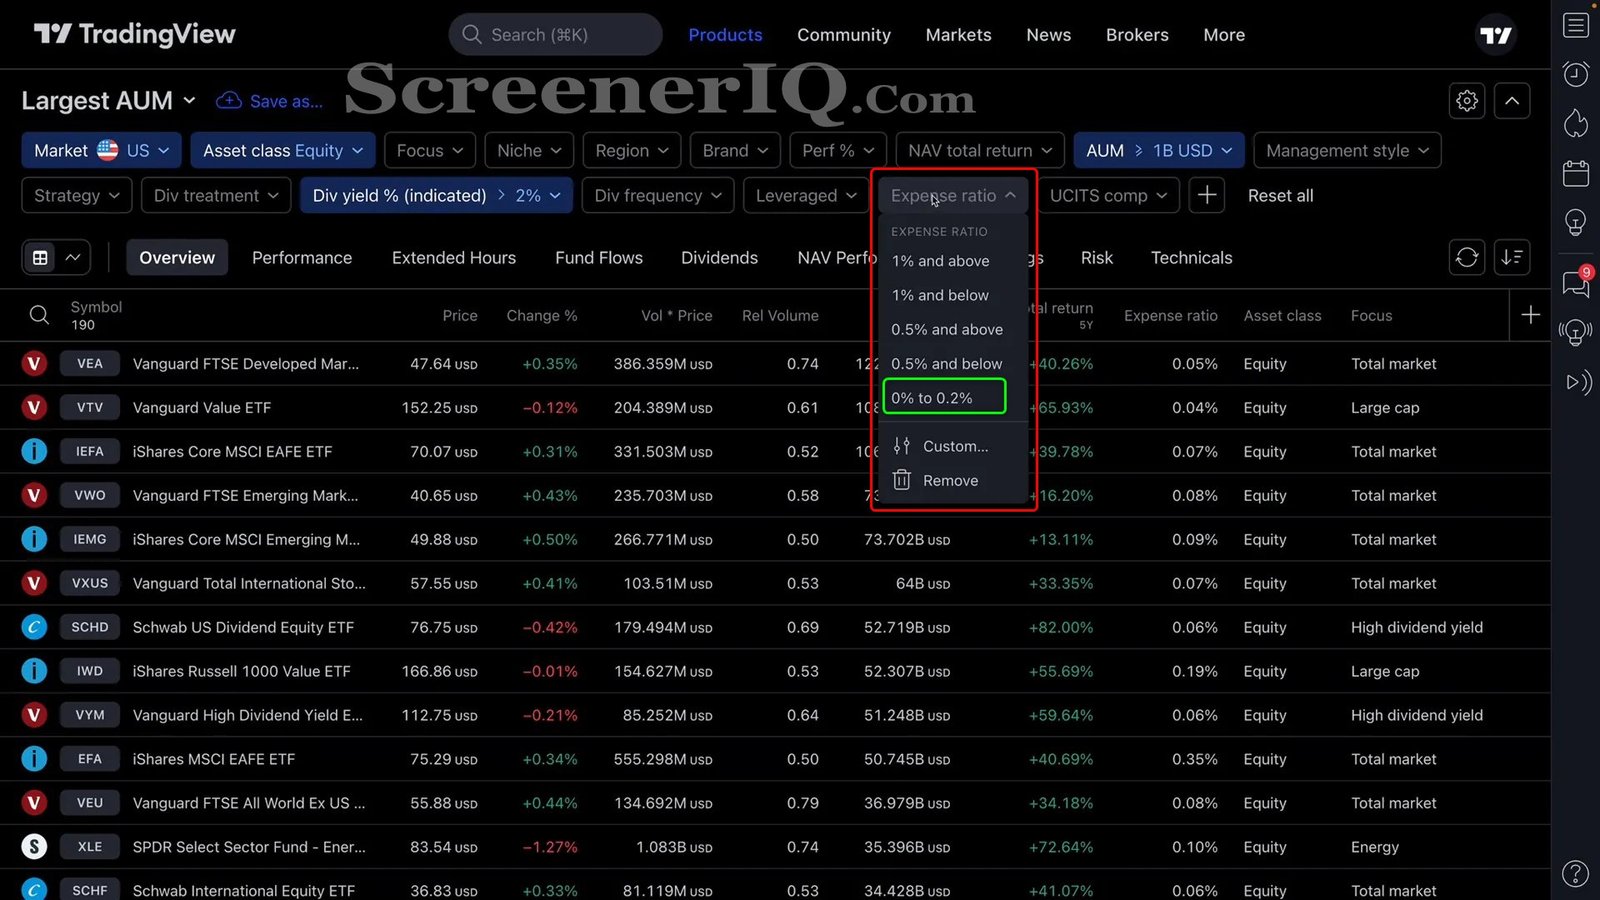
Another crucial metric to filter by is the expense ratio — the cost charged by the fund for managing the ETF. Lower expense ratios mean more of your money stays invested. Setting an expense ratio filter between 0% and 0.2% can further narrow the list to only 71 ETFs.
Additional Filters to Customize Your Search
Beyond these basics, the ETF Screener offers a multitude of filters allowing you to customize your screen extensively. Some of these include:
- Strategies or Management Style: Choose ETFs based on active or passive management styles.
- Net Asset Value (NAV): Filter ETFs by their NAV for valuation insights.
- Total Returns: Narrow down by historical return performance.
- Expense Ratio Sorting: Sort ETFs by lowest to highest expense ratio to identify cost-efficient options.
Learning to use these filters effectively can transform your ETF research process, helping you discover funds that align with your financial objectives.
Creating Custom Screens: An Example with Commodity ETFs
To illustrate the power of the ETF Screener, let’s create a new custom screen focused on commodity ETFs, such as those investing in gold, silver, or copper.
Start by clicking Create New Screen and give it a name, for example, “YouTube ETF Screen Example.” This screen will initially have no filters applied.
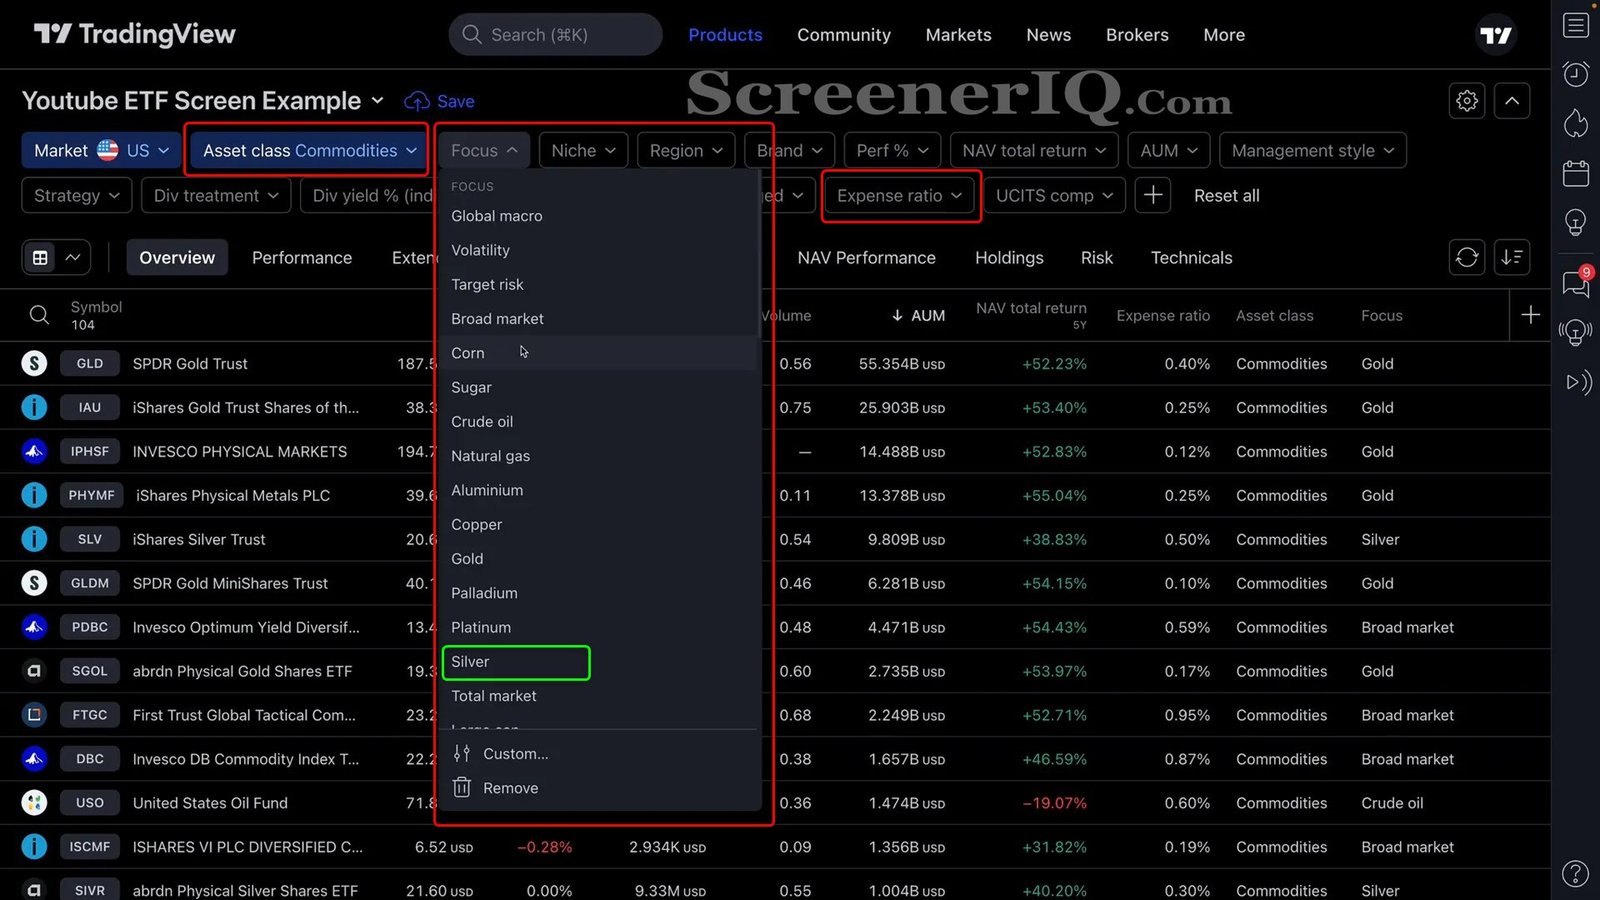
First, select Commodity under the asset class to filter ETFs dealing with physical commodities. This reduces the list to about 104 ETFs.
Next, use the Focus filter to narrow down to specific commodities. For instance:
- Palladium: Due to its rarity, only one ETF appears.
- Silver: Selecting silver narrows the list to six ETFs.
To refine further, apply an expense ratio filter of 0.5% or below. This filter reduces the silver ETF options to just two: SLV and SIVR — two of the most cost-effective silver ETFs available.
Adding More Filters with the Plus Button
If you find that a desired filter is missing from your initial options, use the plus (+) button to explore additional filters. For example, typing “dividend” in the search bar brings up more dividend-related filters you can add to your screen.
This flexibility ensures you have the tools necessary to narrow your ETF selections based on very specific criteria, making the ETF Screener a truly customizable experience.
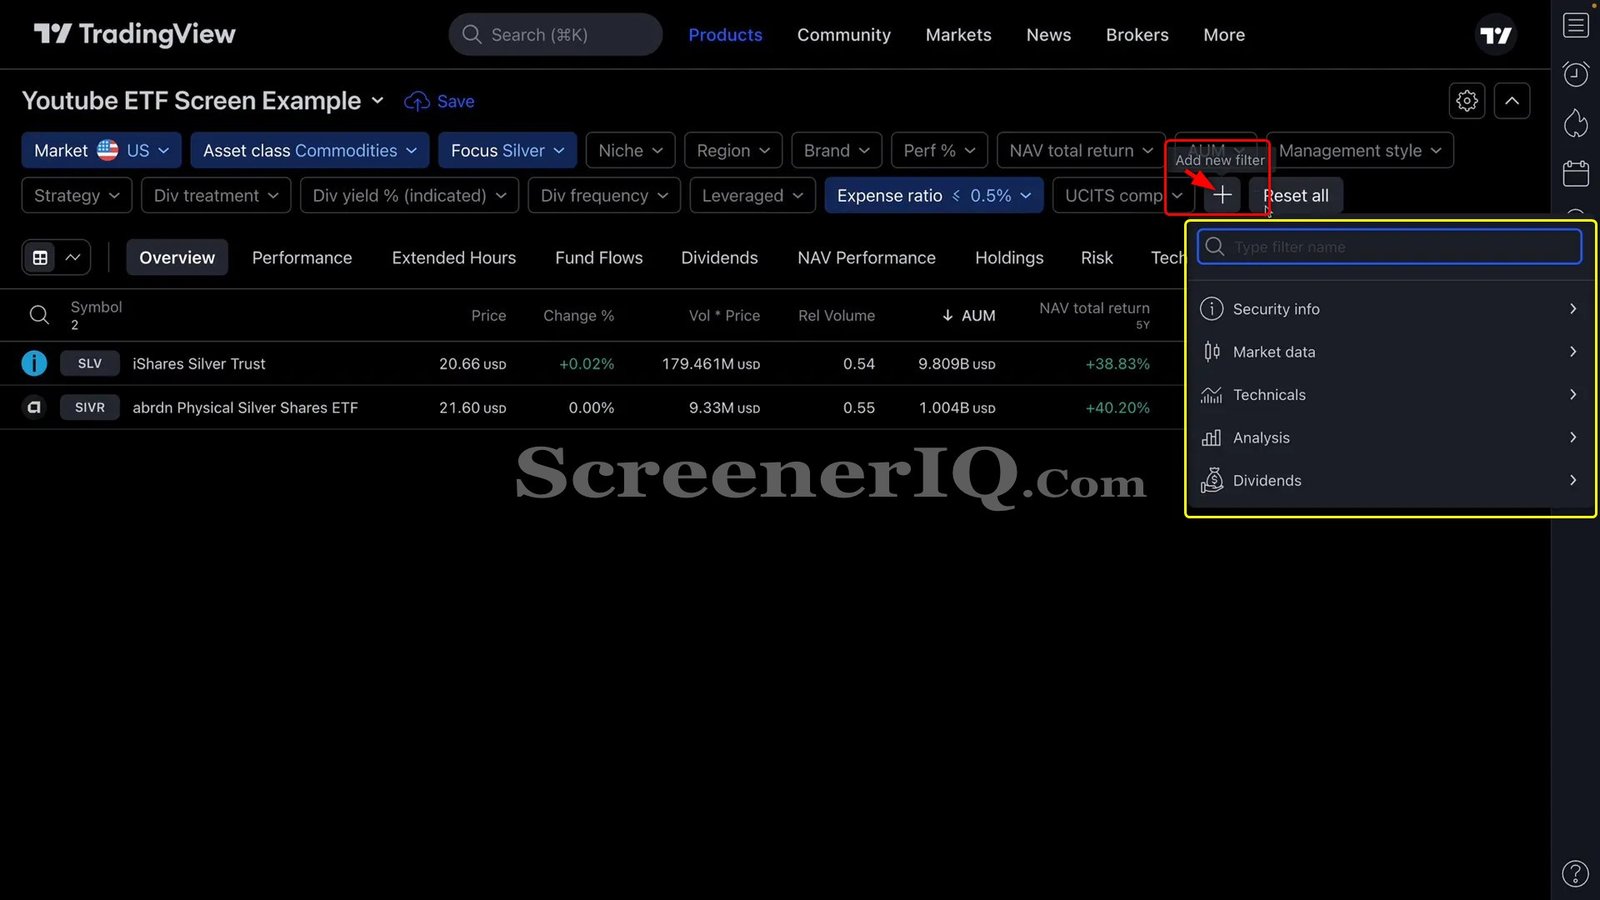
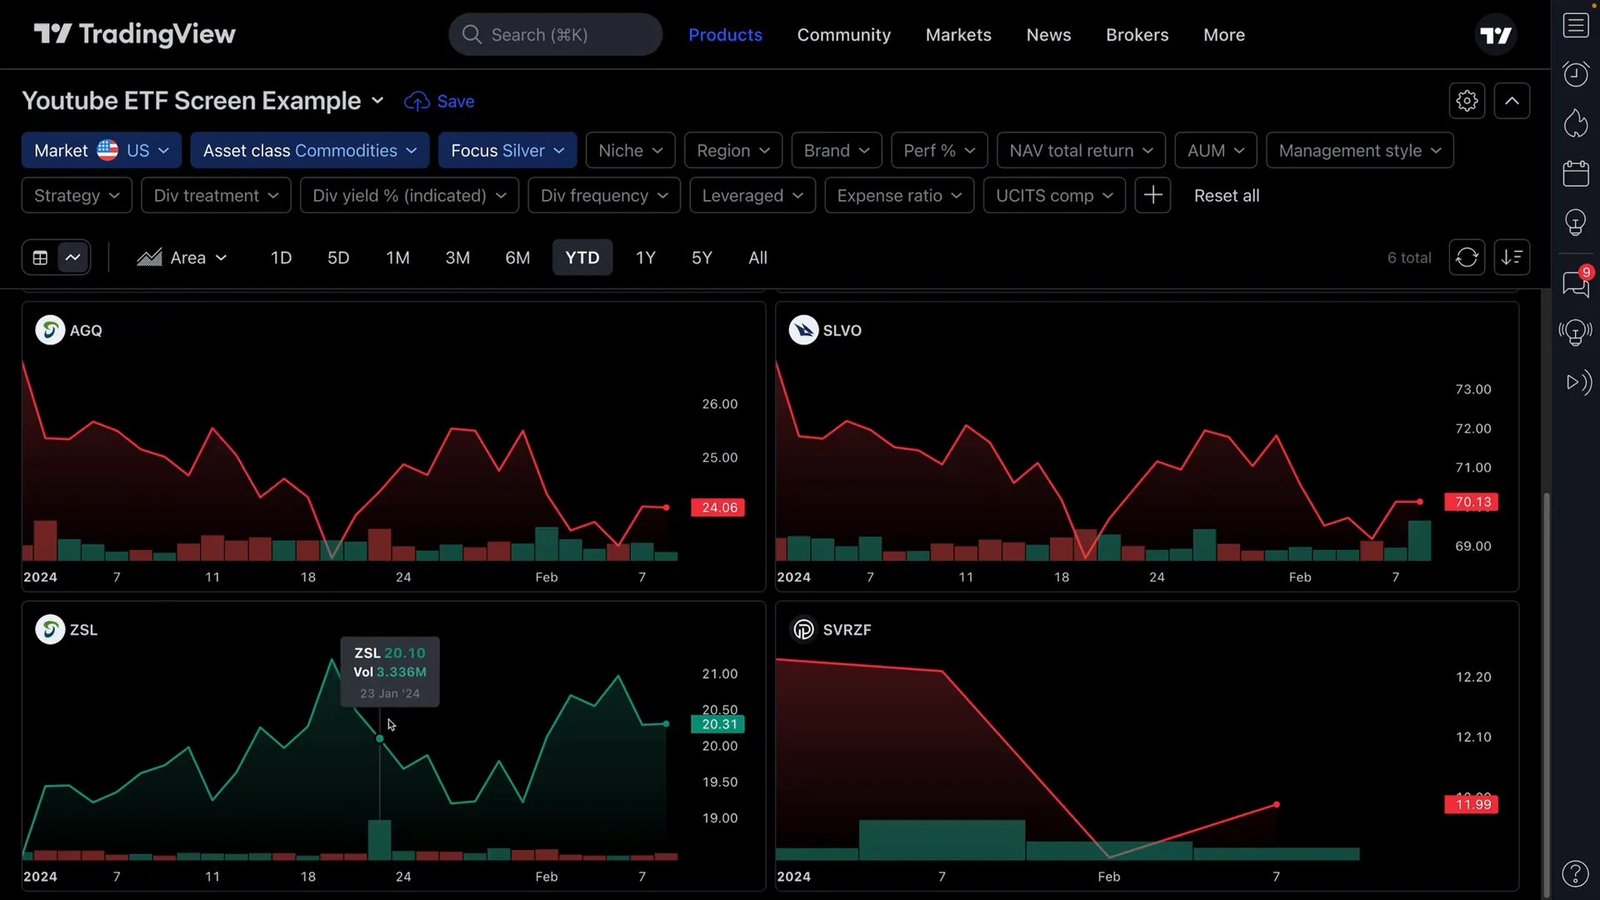
Chart View: Visualize ETF Performance While Screening
One of the standout features of the TradingView ETF Screener is the ability to view ETF charts directly within the screener. This is especially useful for technical investors and traders who want to combine fundamental screening with price action analysis.
By toggling into chart view, you can see the price movements of ETFs over different time frames such as year-to-date or one year. This visual insight helps identify trends or anomalies quickly.
For example, looking at silver ETFs year-to-date, you might notice that while most silver ETFs are down, the ZSL ETF is up by 12%. This kind of insight can prompt further investigation into why this particular ETF is performing differently.
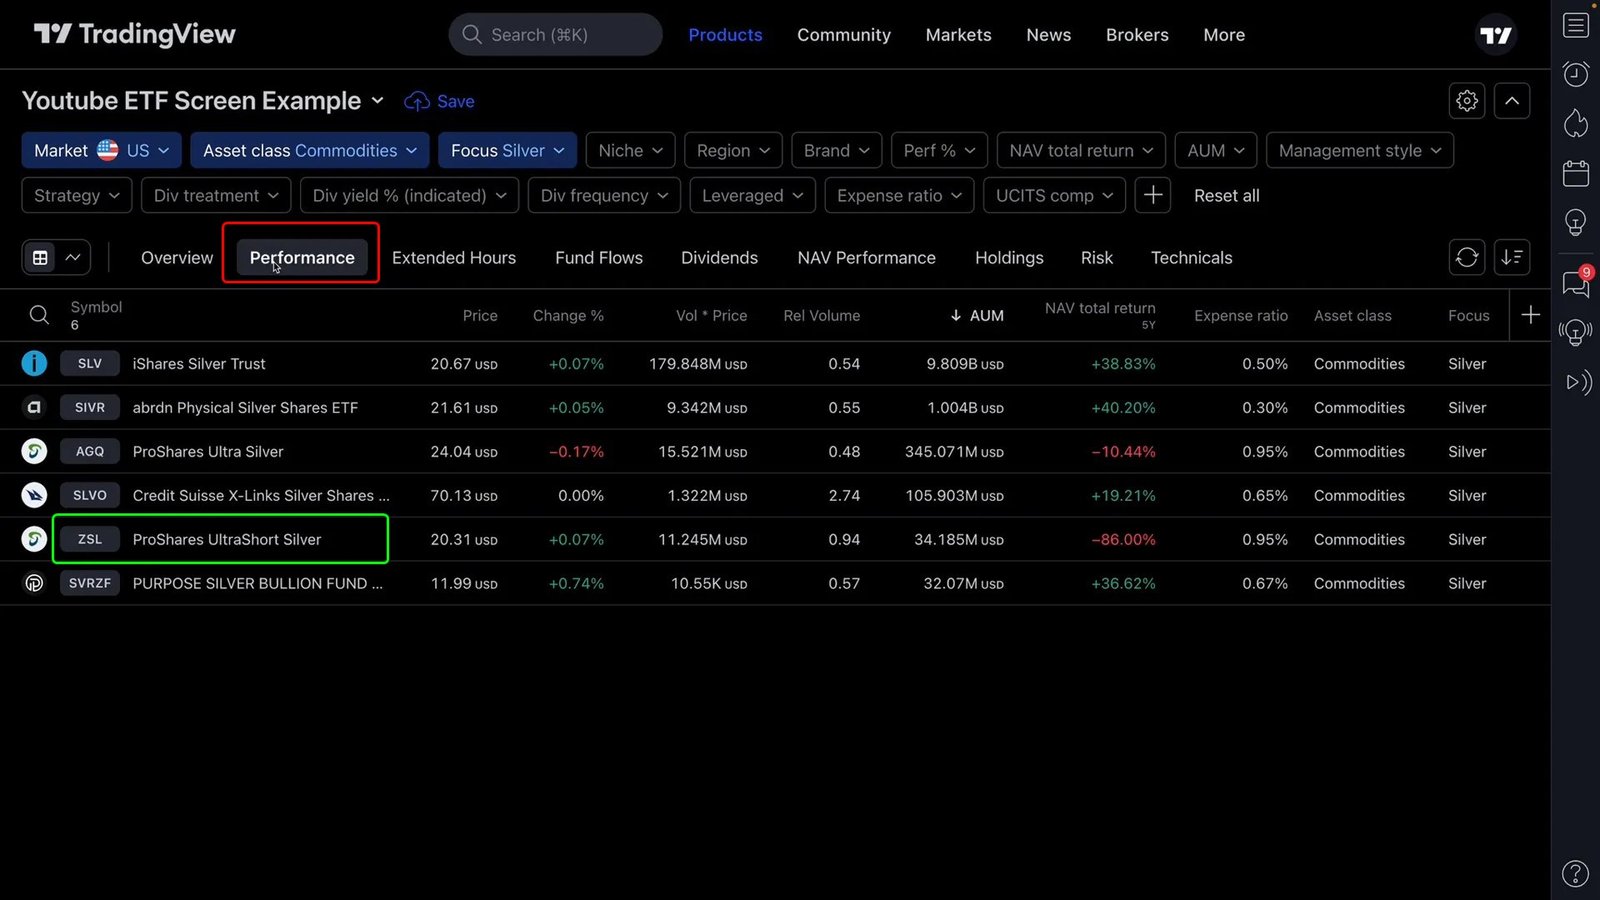
Diving Deeper: Using Key Detail Tabs for More Insight
Once you have identified ETFs of interest, the ETF Screener allows you to explore detailed tabs such as:
- Performance: Review historical returns and compare ETFs side-by-side.
- Fund Flows: Analyze recent inflows and outflows to gauge investor interest.
- Dividends: Check dividend payment history and yield.
- Net Asset Value and Holdings: Understand the underlying assets and valuation.
For instance, the ZSL ETF, which was performing well year-to-date, is actually an inverse leveraged ETF (2x inverse). This explains its unique price behavior compared to traditional silver ETFs like SLV.
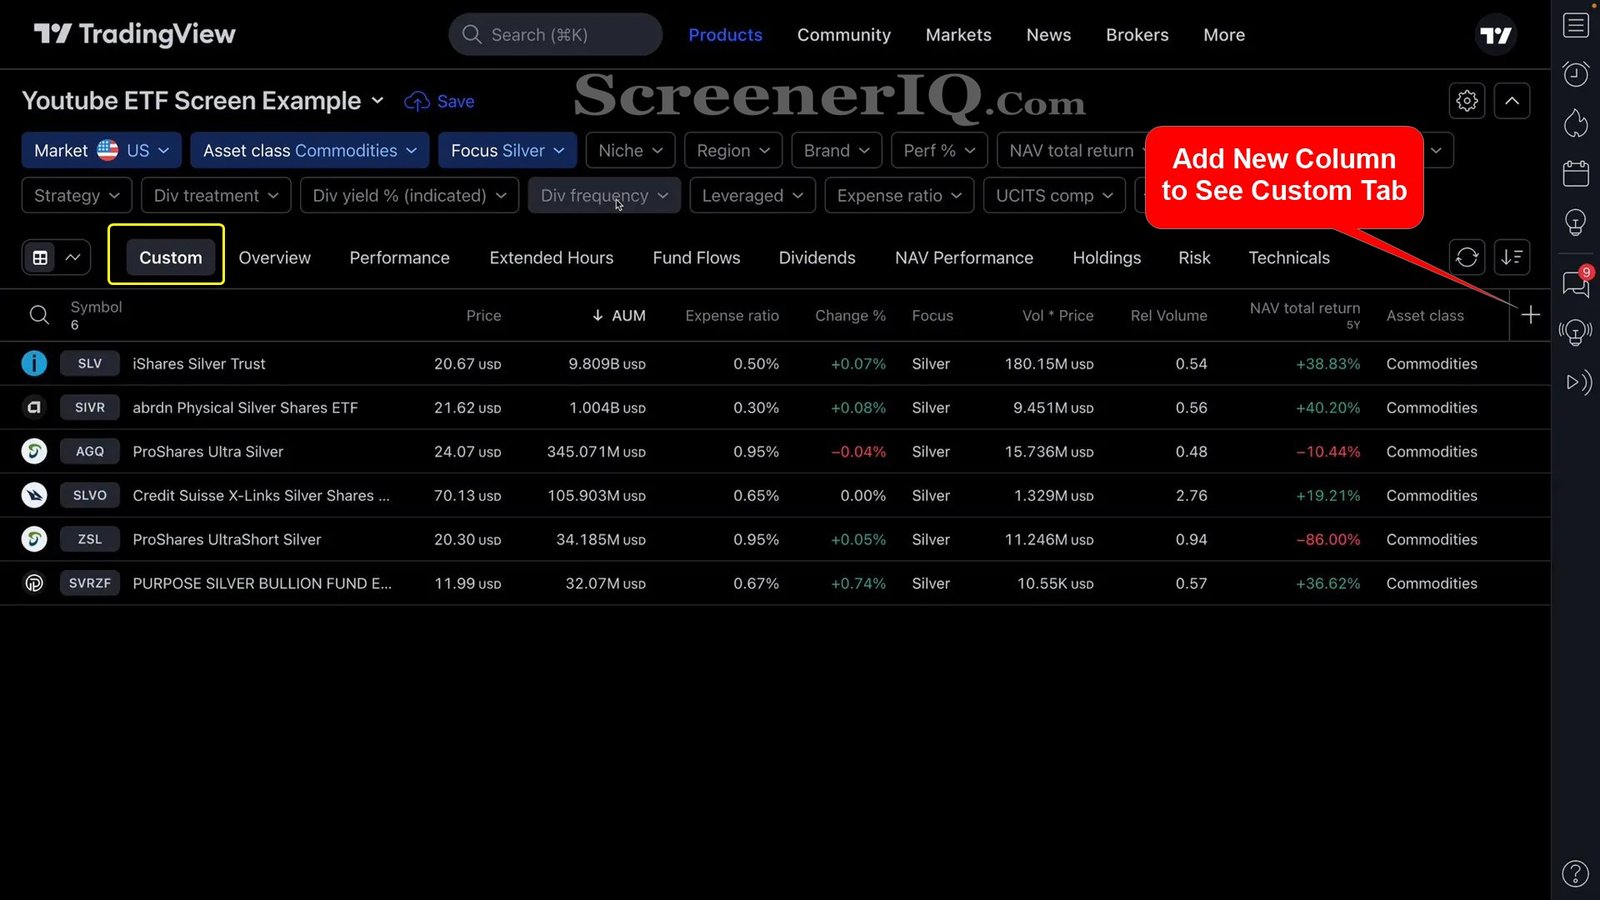
Customizing Columns: Tailor Your View to What Matters Most
Another powerful feature of the ETF Screener is the ability to customize the columns displayed in your results. If you prefer a minimalist view focusing only on key metrics such as price, assets under management (AUM), expense ratio, and focus, you can right-click on unwanted columns and remove them.
Moreover, you can create custom columns by adding specific data points, such as the 50-day simple moving average, from the technicals category. This lets you combine fundamental and technical data in a single view, tailored exactly to your preferences.
Tip: If you do not see the Custom tab.
The custom button will appear when you modify the column set. Either by adding a column by using the [+] button or removing a default column.
Staying Up-to-Date: Refreshing Data and Sorting Options
The ETF Screener allows you to refresh your data at any time to ensure you’re working with the latest market information. This is especially crucial for real-time trading decisions.
You can also set default sorting options to prioritize the metrics most important to your strategy, such as sorting by lowest expense ratio or highest dividend yield.
Final Steps: Exploring Individual ETFs in Detail
After filtering and analyzing ETFs, you can click on any ETF symbol to visit its detailed symbol page. Here, you’ll find even more data, including:
- News related to the ETF
- Trading ideas and technical analysis from other traders
- Comprehensive charts with interactive features
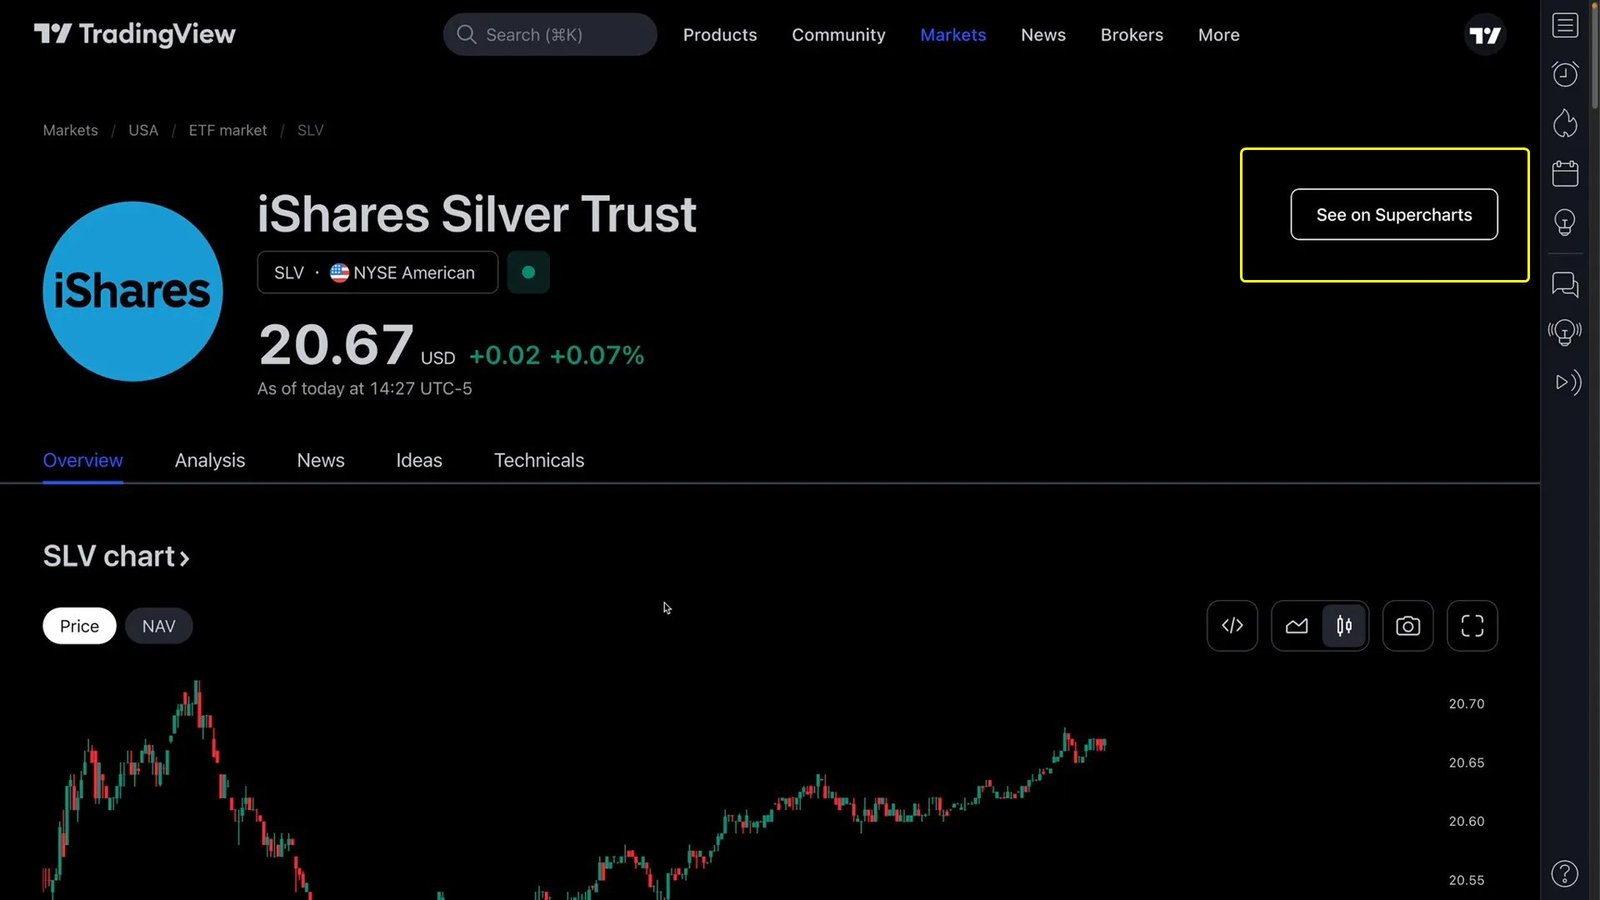
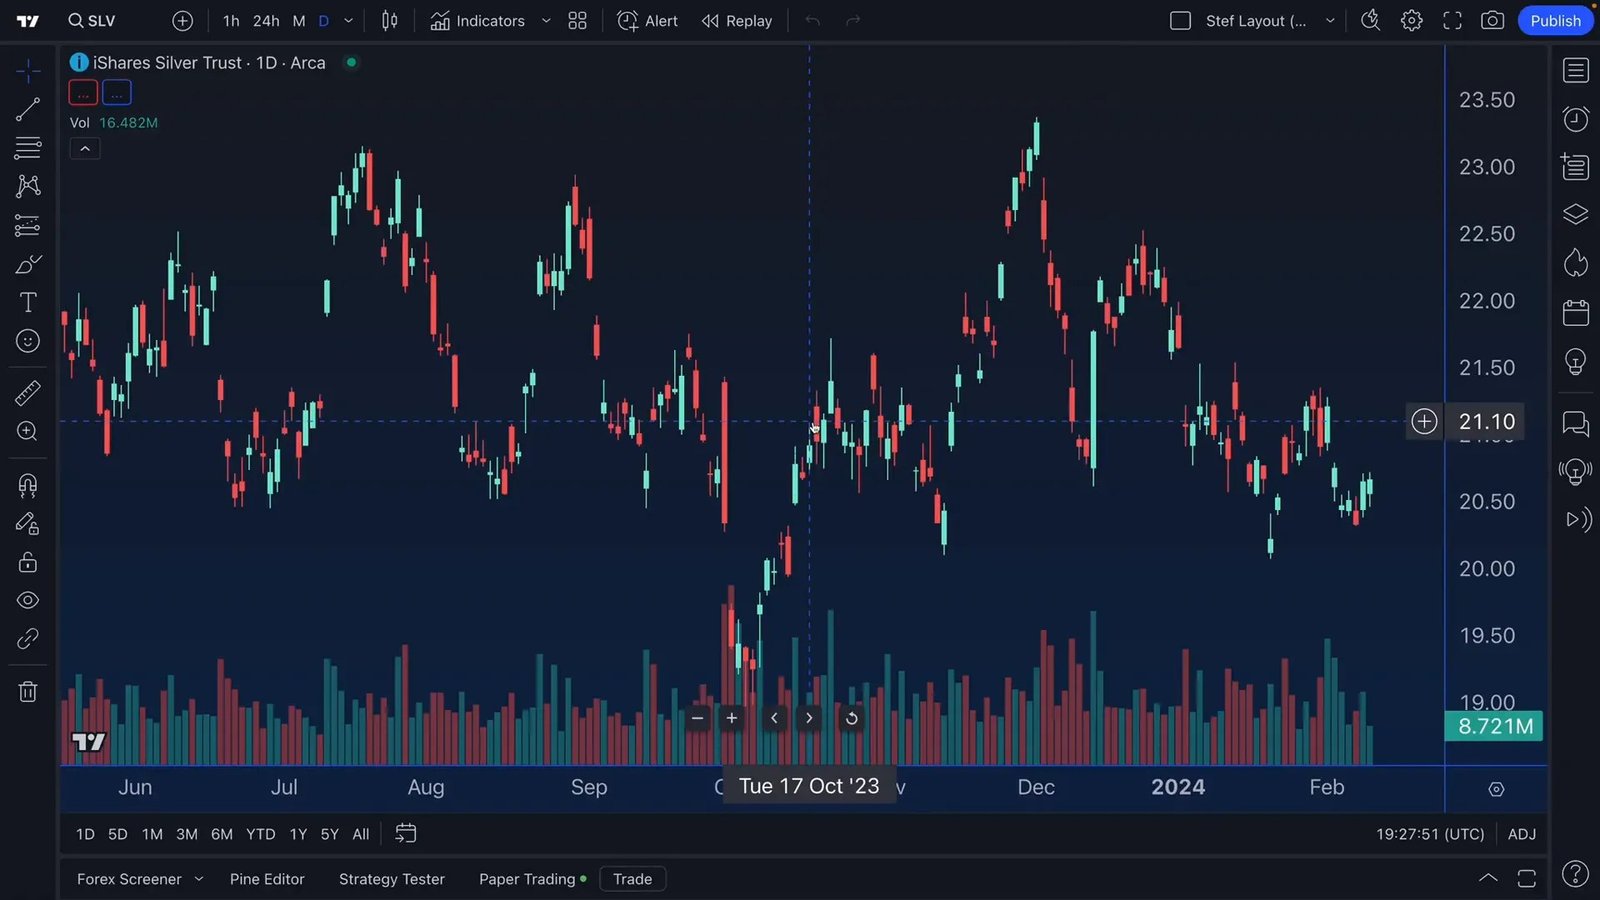
The “Super Charts” button is a favorite, as it brings you directly to an advanced chart view of the selected ETF, allowing you to perform in-depth technical analysis right after your screening process.
Conclusion: Why the TradingView ETF Screener is a Game-Changer
The TradingView ETF Screener is a customizable, and user-friendly tool that helps investors and traders to find ETFs that match their investment strategies.
From beginners to experts, the tool offers:
- Extensive filtering options covering asset classes, dividends, expense ratios, and more
- Ability to create and save multiple custom screens
- Visual chart integration for technical analysis within the screener
- Deep dive tabs offering fund flows, holdings, performance, and other critical data
- Custom column creation and intuitive interface for personalized data views
Mastering this tool can save you hours of research, allowing you to make informed decisions with confidence.
Whether you’re looking for dividend-paying equity ETFs, commodity-focused funds, or niche thematic ETFs, the TradingView ETF Screener is your go-to platform.
Ready to take your ETF investing to the next level?