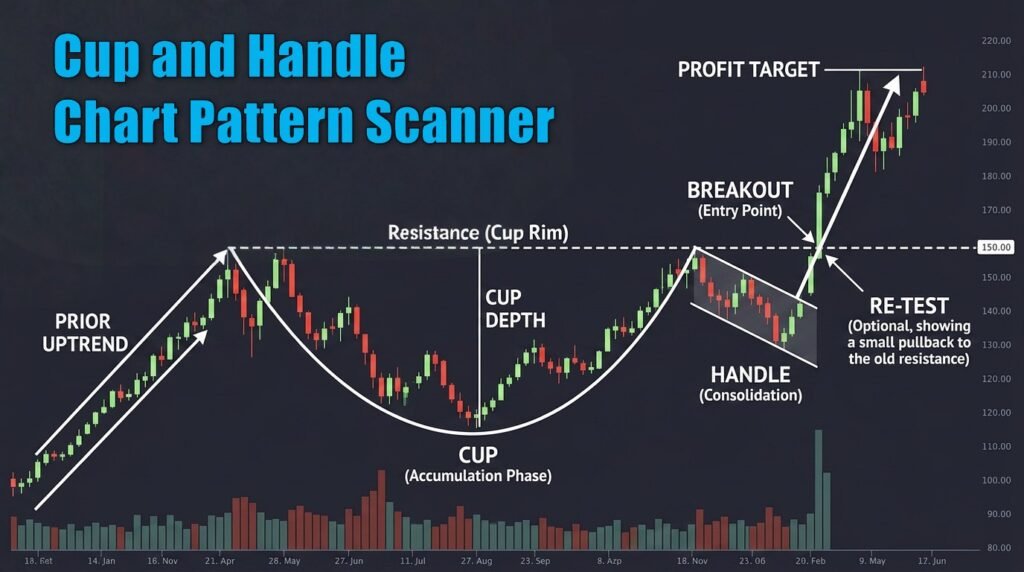
A 52 week high stock screener is one of the most heavily studied filters in technical trading, because stocks that are already showing strength statistically tend to keep showing it.
This guide covers the logic behind the setup, the exact filter criteria to build the screen on any major platform, and how to separate a genuine breakout from noise once the results are in front of you.
What Is a 52-Week High?
A 52-week high is the highest price a stock has traded at over the past 12 months, roughly the last 252 trading days. When a stock closes above that level, every shareholder who bought in the past year is sitting on a profit.
There’s no pocket of buyers waiting to sell at breakeven and cap the move, which is exactly what gives new-high breakouts their characteristic follow-through.
The logic was formalised by William O’Neil in his CAN SLIM methodology, which deliberately looks for stocks making new highs rather than cheap or beaten-down names.
The core idea being that stocks already showing strength tend to keep showing it.
The CAN SLIM screener guide on this site covers that framework in more depth.
The 52 Week High Stock Screen
Here’s a screener setup designed to find stocks breaking out to new 52-week highs on strong volume, while filtering out illiquid, low-priced, or unconfirmed moves.
52 Week High Stock Screener
Purpose: Identify stocks breaking out to new 52-week highs with genuine volume confirmation and enough liquidity to trade.
- Price condition: At a new 52-week high (today’s close at or above the highest price of the past 252 trading days)
- Exchange: NASDAQ, NYSE
- Instrument type: Common stock
- Market capitalization: $300 million or higher
- Share price: $15.00 or higher
- Average daily volume (3-month): 500,000 shares or more
- Relative volume: 1.5x average daily volume or higher (volume surge)
- Change %: Positive on the breakout day
The 52 Week High Stock Screener Can Be Used On:
Here’s a summary in table form.
| Filter | Setting | Explanation |
| Price condition | At a new 52-week high | The setup itself — today’s close is at or above the highest price of the past 252 trading days |
| Exchange | NASDAQ, NYSE | Keeps results to actively regulated, liquid US exchanges |
| Instrument type | Common stock | Excludes ETFs, preferred shares, warrants, and SPAC units, which distort a pure stock screen |
| Share price | $15.00 or higher | Removes low-priced stocks prone to wide spreads and manipulation |
| Market capitalization | $300 million or higher | Filters out micro-caps if you want a more institutional-quality list |
| Average daily volume (3-month) | 500,000 shares or more | Liquidity floor — makes sure you can enter and exit a position without excessive slippage |
| Relative volume | 1.5x average daily volume or higher | The single most important quality filter here — confirms institutional participation in the move |
| Change % | Positive on the breakout day | Confirms the stock closed higher on the day it made the high, rather than touching it intraday and fading |
Setting This Screen Up
TradingView’s Stock Screener 2.0 has a built-in “New 52 Week High” filter under the Technical tab. It only takes a search and click to add the filter. It really is that simple.
Add Relative Volume and Average Volume (3 month) as columns and you’ve got the full screen running end of day.
A screen like this typically runs once per day after the close, so it’s an end-of-day scan rather than a live feed.
If you want to watch new highs form in real time during the session, TradingView’s market movers page tracks it live.
Trade Ideas runs a dedicated new-highs channel with the ability to stack volume, momentum, and technical filters simultaneously. You can read the full Trade Ideas review for more info.
How to Read the Results
Once the screen is built, you’ll typically be looking at: ticker and company name, price (the level that set the new high), change % (the move on the day the high was set), volume, and relative volume.
Volume confirmation is the single most important thing to check. A new high on volume 50% or more above average signals that institutional money, funds and large traders, are actively participating. A new high on thin, below-average volume is a much weaker signal and tends to fade.
A few practical ways to sort the list:
- Sort by relative volume descending to show the highest-conviction breakouts first
- Sort by change % descending to find stocks combining a new high with the strongest same-day momentum
- Scroll past the first page rather than only looking at the top results. Strong setups often sit mid-list where less attention lands
Why Traders and Investors Watch This List
The 52-week high stocks list is useful across several styles of trading, each for a slightly different reason.
Momentum traders use it as a primary discovery tool. A stock breaking to a new annual high on strong volume is showing exactly the kind of price strength momentum strategies are built around, a clean, well-defined breakout level with no overhead supply in the way.
Swing traders use it to find stocks emerging from multi-week or multi-month bases. A stock that has consolidated for weeks and then breaks to a new high, particularly in a healthy broader market, is one of the more reliable swing setups. The prior base acts as a launchpad and the new high confirms sellers have been absorbed.
Position traders use the list to identify stocks in strong secular uptrends. A name that keeps reappearing near its 52-week high quarter after quarter is showing the kind of persistent strength that can underpin a multi-month position.
Even investors who don’t trade breakouts use the list as a market health check. A session where hundreds of stocks are making new highs is a structurally different environment from one where only a handful are. The breadth of this list is itself a useful indicator of market strength.
52-Week Highs vs. All-Time Highs
These are related but distinct setups. A 52-week high means a stock is at its highest point in a year. It may still have traded higher in prior years, which means there’s overhead resistance above the current price from longer-term holders who bought at higher levels.
An all-time high is the stronger signal in one respect. The stock has cleared every prior seller at any price in its history, so there’s no ceiling at all. For that specific setup, see the breakout stocks screener on this site.
For most practical purposes, the 52-week high screen is the more useful everyday tool. It finds a larger universe of stocks and captures breakouts at a meaningful technical level without requiring a stock’s entire trading history to be behind it.
The Psychology of New Highs
There’s a well-documented behavioural bias called anchoring that causes a lot of traders to avoid buying at new highs. The instinct is to wait for a pullback to a lower, more “comfortable” price.
In practice, this often means missing the strongest trending stocks entirely, since they can keep running without giving back the pullback that’s being waited for.
The counterintuitive reality, backed by a long body of market research, is that new highs tend to beget new highs. Stocks that are already strong keep attracting buyers.
A 52-week high stock screen is effectively the market’s own shortlist of its strongest names. The skill is in identifying which breakouts have genuine volume behind them and which are false starts.
52 Week High Stocks Checklist
- Check the chart: is the stock breaking cleanly from a base, or has it been grinding higher for a while already?
- Check the volume on the breakout day: is it materially above average, or a low-conviction move?
- Check the broader market: breakouts in a strong uptrend have a much higher follow-through rate than those in a weak or choppy tape
- Look for a catalyst, or confirm the move is purely technical: both can work, but knowing which one applies helps set expectations
- Consider the sector: a breakout in a leading sector carries more weight than one in a lagging group
Conclusion
A 52 week high stock screener list isn’t a buy signal on its own. It’s a way of cutting a market of thousands of stocks down to the small number that are already proving they can move.
What you do with that list is where the real work starts. Checking the volume, reading the chart, and deciding whether a name deserves a spot on your watchlist or an entry today.
Run the stock screener on the same schedule every session, don’t skip past unfamiliar tickers just because they’re unfamiliar. Over time you’ll start recognizing the sectors and setups that keep showing up before you’ve even opened a chart.
Try The 52 Week High Stock Screener On:
Related Stock Screeners
Educational content only, not financial advice.Content may contain affiliate links.