
The cup and handle chart pattern has been a staple of breakout trading for decades. It became widely known through William O’Neil’s work on growth investing and the CANSLIM methodology, and for good reason.
When this pattern forms properly, it can highlight stocks that are building a base, tightening up, and preparing for a potential move higher.
The challenge has never been understanding the idea. The challenge has been finding these setups early enough, across enough symbols, without spending hours manually scrolling through charts.
That is where automation changes everything. Several stock screeners/scanners can now automatically detect the cup and handle chart pattern on any timeframe.
Additionally, you can customize how those patterns are identified, run scanners built specifically to find names that are either forming the setup or already breaking out.
Even better, you can combine those scans with CANSLIM-style filters and then use AI to rank the final list based on the factors that matter most to your process.
Recommended Cup and Handle Chart Pattern Scanner
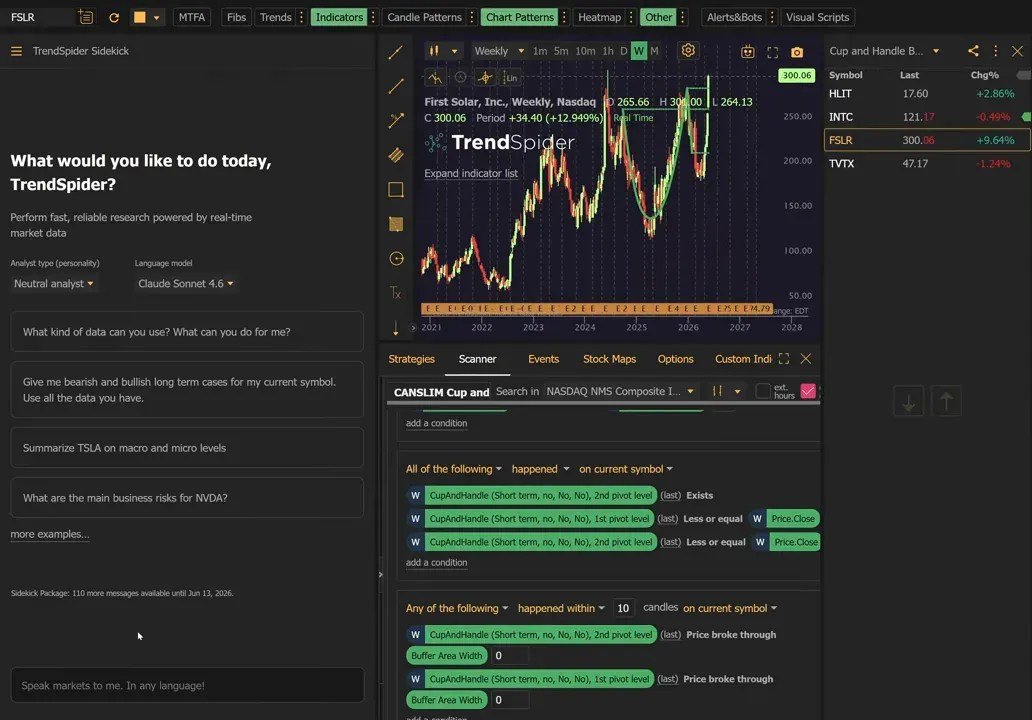
For this guide we will be using TrendSpider as it includes both, a cup and handle scanner, and a CANSLIM scanner based on fundamental metrics.
Why The Cup and Handle Chart Pattern Still Matters
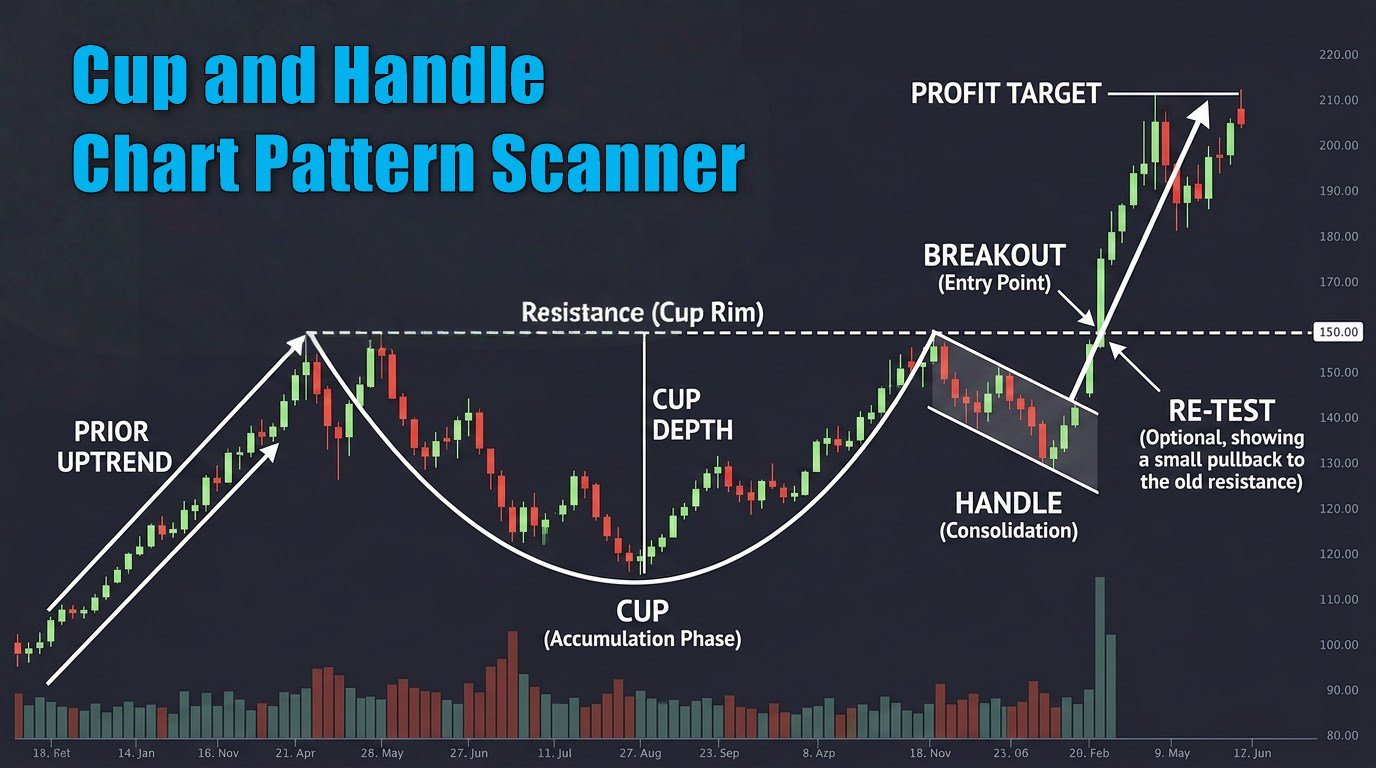
At its core, the cup and handle chart pattern is a continuation setup.
Price pulls back, rounds out into a broad base, and then consolidates in a smaller pullback before attempting a breakout.
The rounded cup often reflects a longer reset in supply and demand. The handle can represent the final shakeout before buyers try to push the stock through resistance.
Traders like the pattern because it gives them structure:
- A visible base
- A clear area of resistance
- A defined pullback zone in the handle
- A potential breakout trigger
That said, identifying a valid cup and handle pattern consistently can be subjective when done manually. One trader sees a textbook setup, another sees a messy range.
Automating the detection process helps remove a lot of that inconsistency and dramatically speeds up idea generation.
How to Automate Cup and Handle Detection
Note: This section is for detecting cup and handle patterns that have already occurred on a chart.
We will cover scanning for forming setups and breaking out setups later.
Turning on automatic recognition is simple.
In the chart interface, head to the chart patterns menu above the chart and open the options menu next to it. From there, enable cup and handle detection.
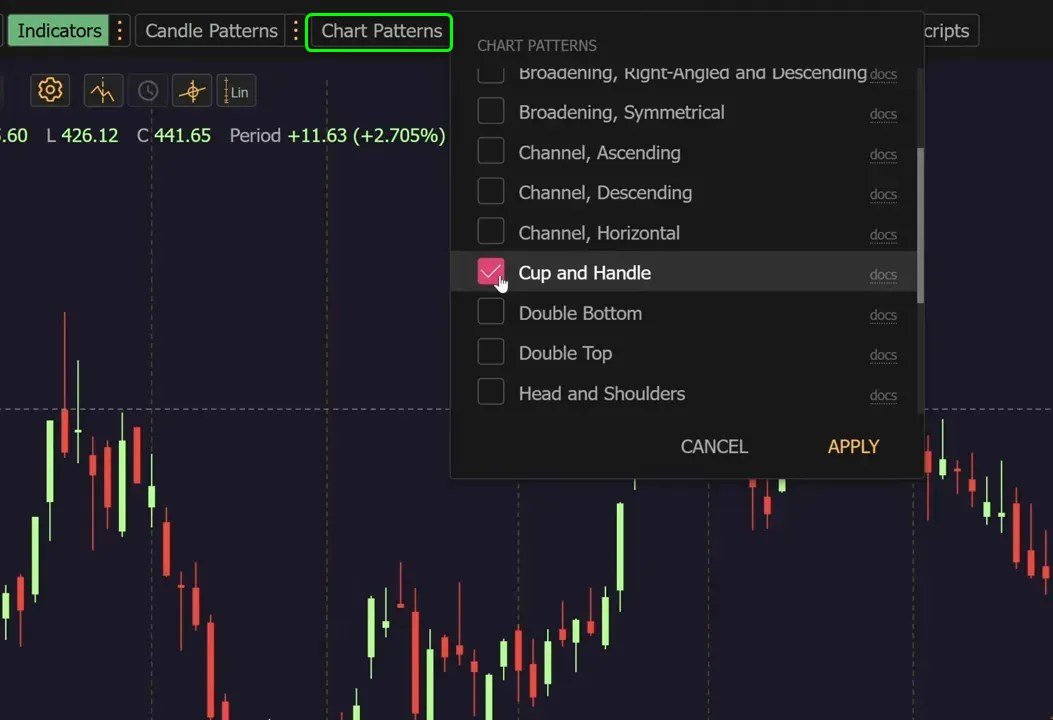
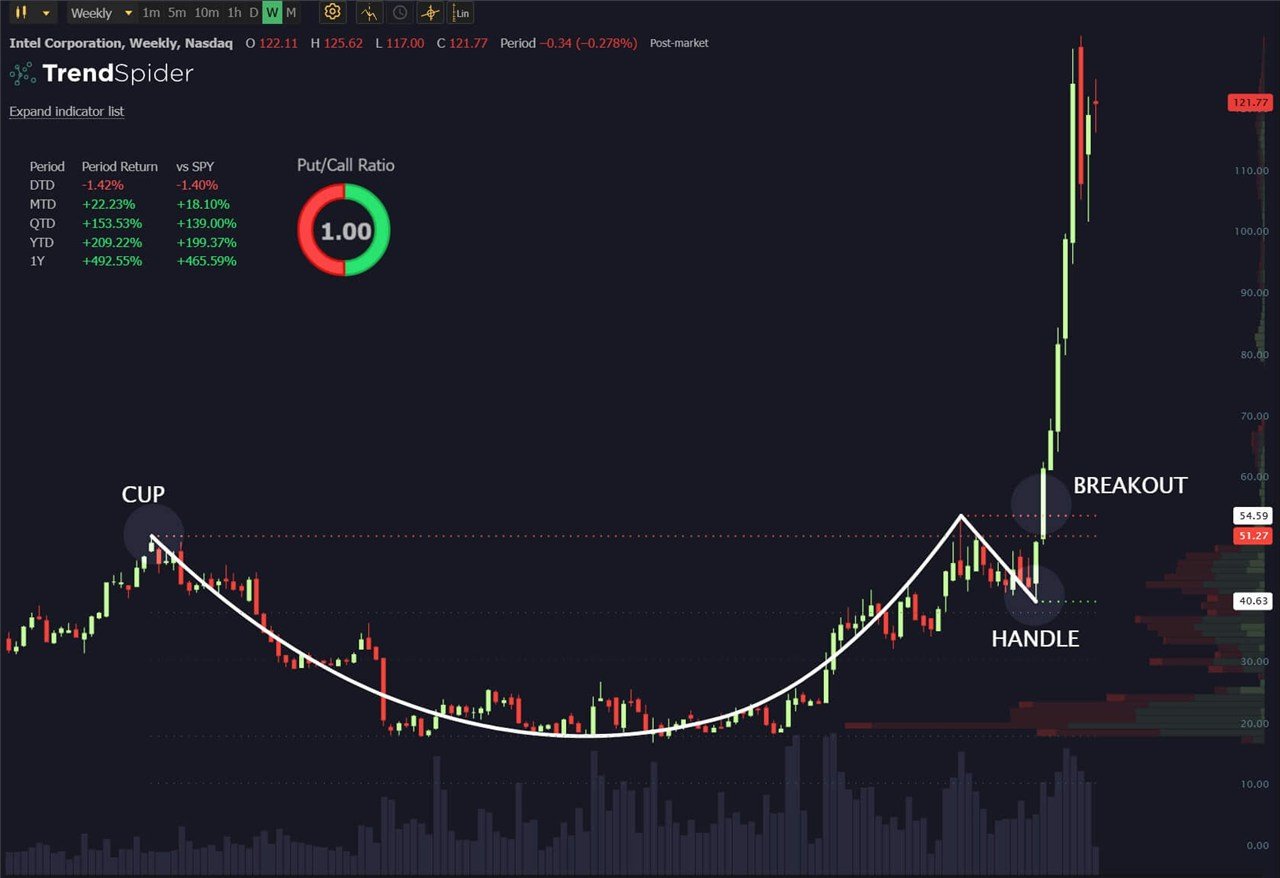
Once that setting is active, TrendSpider starts identifying and drawing the cup and handle pattern directly on the chart for you.
That means no hand-drawing, no guesswork, and no bouncing between symbols trying to decide whether a pattern is there.
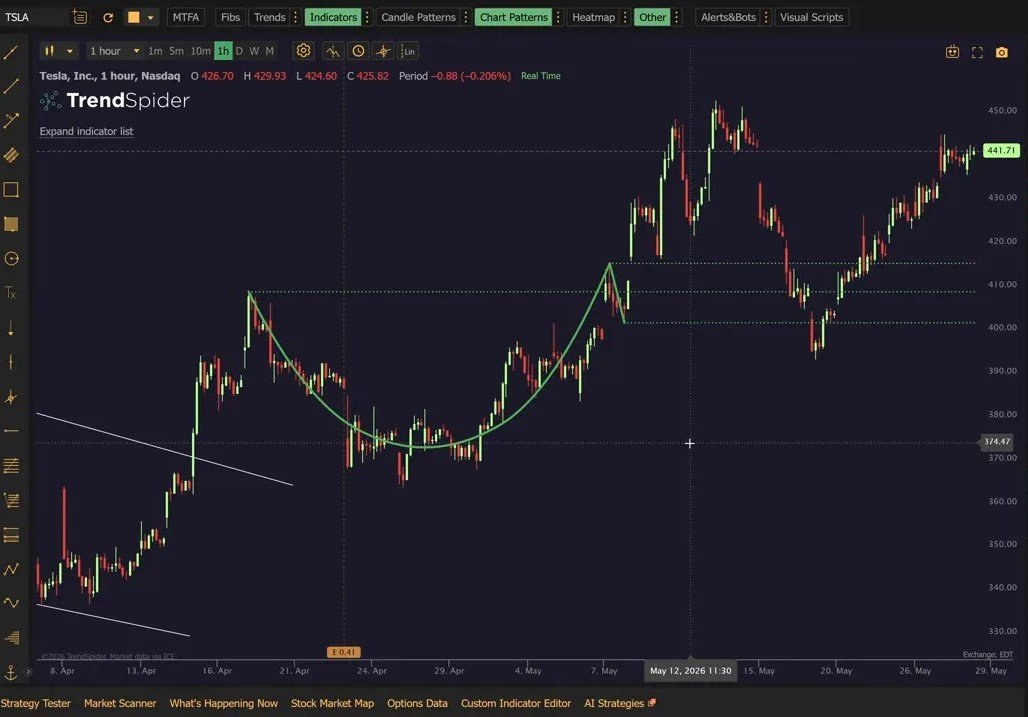
The platform can scan any timeframe, which is important because this setup can appear in very different contexts depending on how you trade.
- Short-term traders may care about patterns on intraday charts
- Swing traders may focus more on daily setups
- Position traders may prefer larger structures on weekly charts
Instead of limiting the pattern to one style, the tool gives you flexibility to adapt the detection to your own trading horizon.
Adjusting Pattern Settings For Your Strategy
Not every cup and handle chart pattern should be treated the same. A quick intraday setup is very different from a multi-month base on a daily or weekly chart. That is why the settings matter.
Short-term vs. Long-term Detection
Inside the pattern settings, you can switch between short-term and long-term detection. This helps narrow the platform’s search to the kind of structure you actually want to trade.
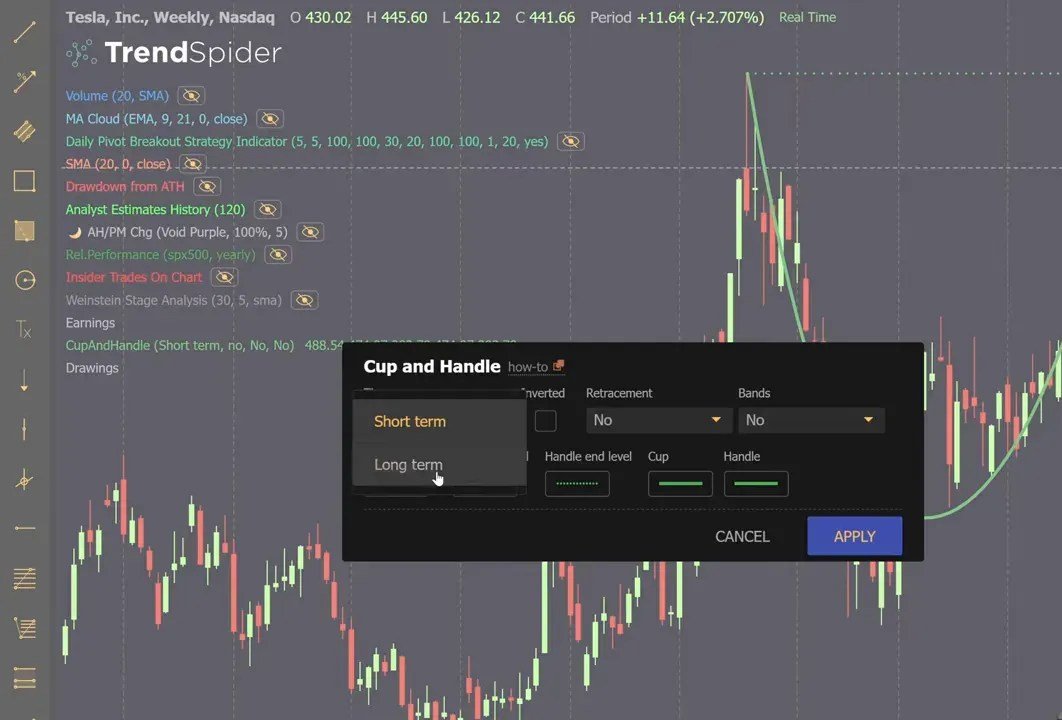
If you are looking for faster-moving momentum names, short-term detection may be a better fit. If you prefer more developed bases with broader accumulation, long-term detection can help isolate those opportunities.
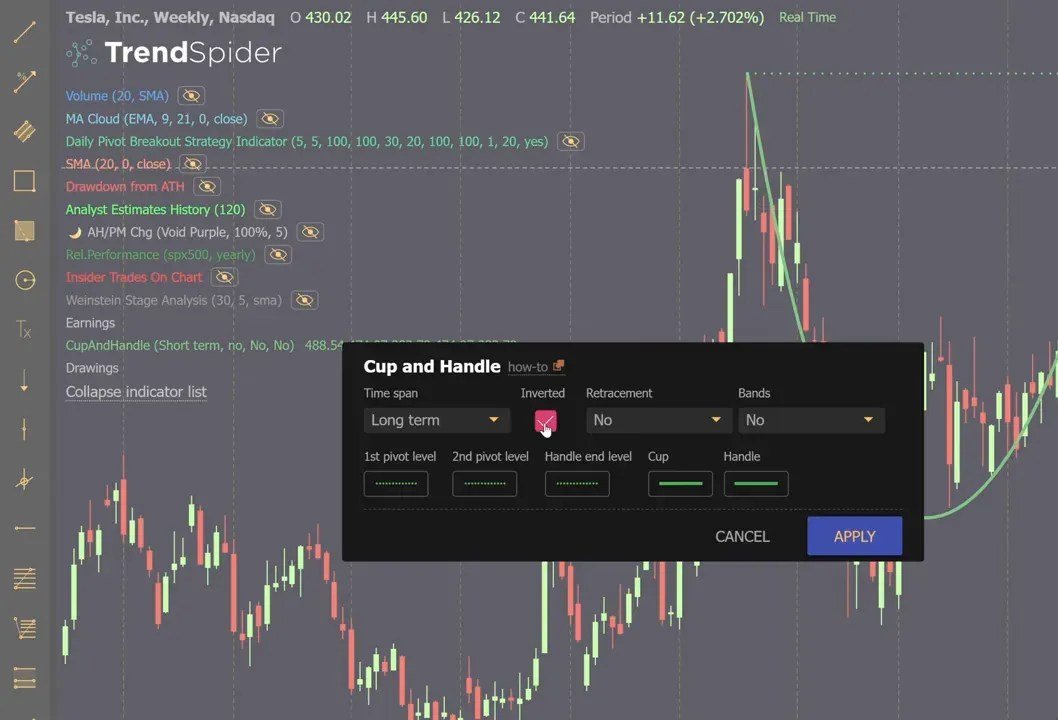
Inverted Cup and Handle For Bearish Setups
The concept is not limited to bullish breakouts. TrendSpider also lets you flip to an inverse version of the pattern so you can search for bearish setups as well.
That is useful for traders who want to:
- Find potential downside breakdowns
- Analyze weak names in soft market conditions
- Apply the same pattern logic in reverse
In other words, the cup and handle chart pattern framework becomes a two-way tool rather than a one-sided bullish screen.
Fibonacci Levels and Bands
One of the more practical features is the ability to overlay Fibonacci retracement levels or bands derived from the pattern’s key price levels.
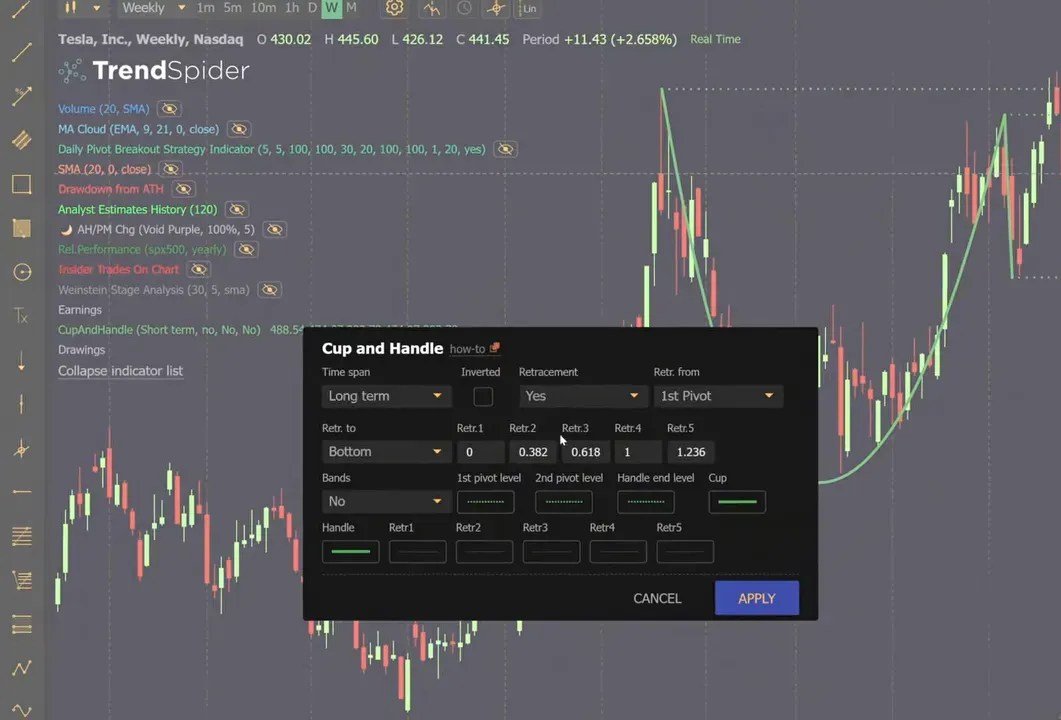
This adds context beyond just the shape of the setup. Instead of seeing only the cup and handle drawn on the chart, you can also map potential support, retracement, and extension zones tied to that pattern structure.
For traders who use confluence in their process, that can help answer a few important questions:
- Is the handle pulling back into a reasonable area?
- Where might support be if the breakout retests?
- Which levels line up with the pattern’s most important price zones?
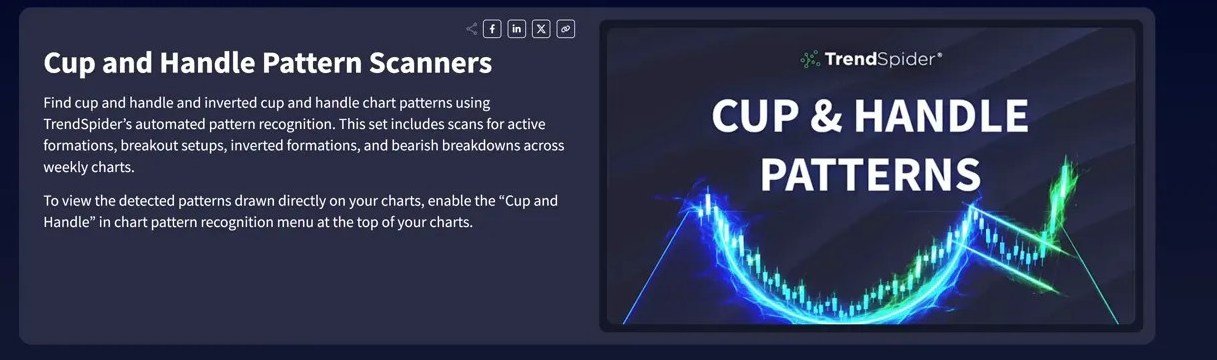
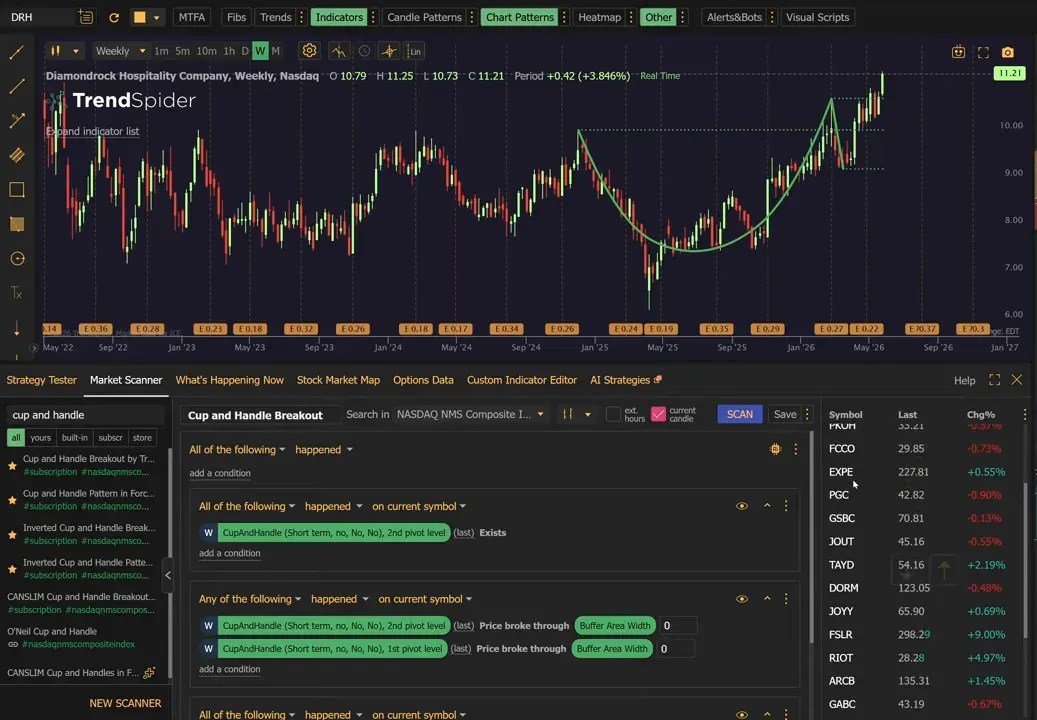
The Cup and Handle Chart Pattern Scanner
Drawing a pattern on a chart is useful.
But scanning an entire market for that pattern is where the workflow becomes much more powerful.
TrendSpider includes pre-built scanners that look specifically for the cup and handle pattern. These scanners are designed to find stocks in two main categories:
- Stocks with a formed cup and handle that are still waiting to break out
- Stocks that are actively breaking out of the pattern
That distinction matters.
Some traders want to catch the setup before the move starts so they can build a watchlist and monitor entries near resistance.
Others would rather focus only on names that are already confirming with an actual breakout. Having scanners for both use cases makes the process much more practical.
How to Use the Chart Pattern Scanners
The pre-built scans can be imported and then run against the stock universe of your choice.
For ALL chart pattern scanners use this link: Chart Pattern Scanners
Use this link for all the Cup and Handle Pattern Scanners
Once imported, the workflow is straightforward:
- Select the scan
- Choose the universe you want to search
- Run the scan
- Review the resulting list of symbols
The output gives you a focused group of stocks where the cup and handle chart pattern is already present or where a breakout signal is happening now.
That is a big improvement over broad momentum scans that produce a noisy list requiring much more cleanup.
Since the scan logic is already built, you can spend your time evaluating the quality of each setup instead of building the pattern search from scratch.
Combining the Cup and Handle Chart Pattern With CANSLIM
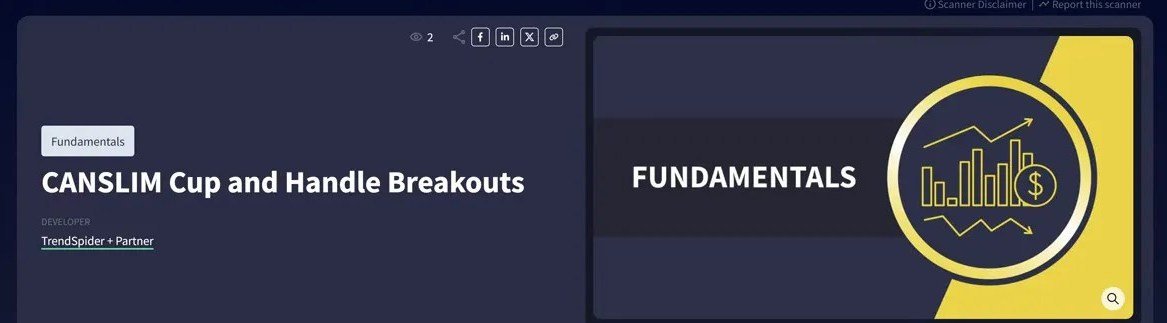
These are pre-built Marketplace scanners users can import into TrendSpider.
For the fundamental Scans use the following links:
One of the strongest ideas in this workflow is combining technical pattern recognition with a fundamental growth filter.
TrendSpider also offers scanners that merge the cup and handle chart pattern with CANSLIM-style criteria.
Instead of finding every possible breakout setup, these scans narrow the list to stocks that also align with factors commonly associated with stronger growth names.
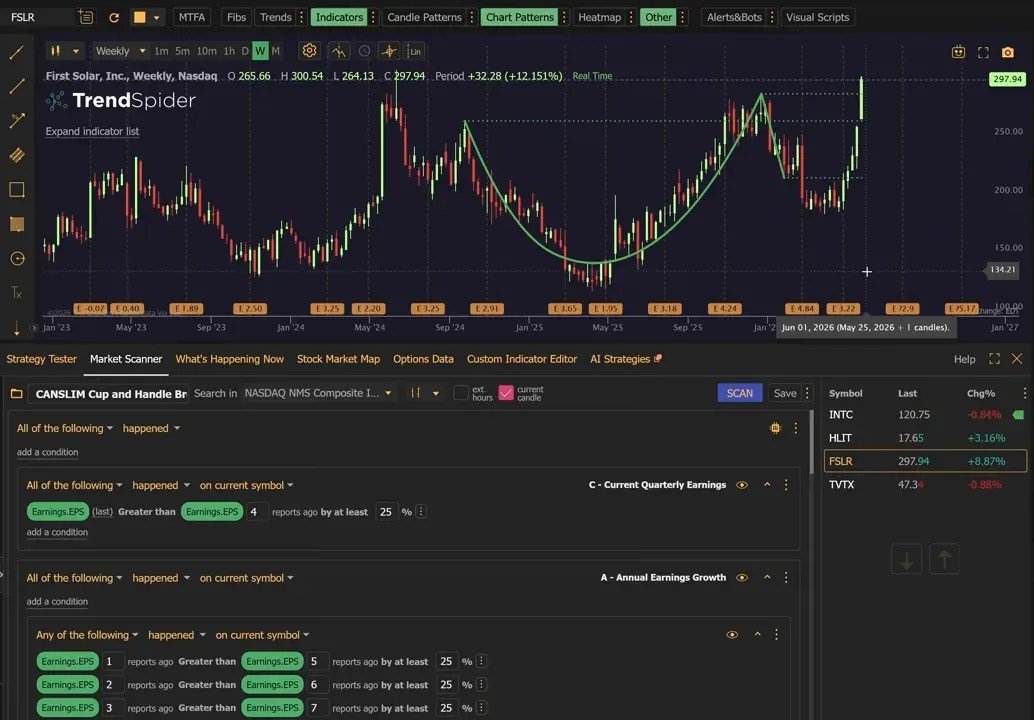
Fudamental metrics include:
- Revenue growth
- EPS growth
- Relative performance
This is important because not all breakouts are equal. A chart can look clean while the underlying business is lagging.
On the other hand, when a technically strong setup also appears in a stock with healthy growth characteristics, the idea often gets more interesting.
That does not guarantee success, of course. Nothing does. But it helps stack multiple forms of evidence together:
- Technical structure from the pattern itself
- Timing from the breakout scan
- Fundamental strength from CANSLIM-related filters
If your process already blends charts and fundamentals, this can save a huge amount of time.
Build a Watchlist From Scan Results
Once you run the scans, the next step is not to blindly trade everything that appears. The better approach is to use the results to build a focused watchlist.
This matters because the scanner is giving you candidates, not final decisions. From there, you can review each chart and ask:
- Is the cup well-formed or sloppy?
- Is the handle constructive or too deep?
- Is price tightening near resistance?
- Is the breakout already extended?
- Does the setup fit my timeframe and risk tolerance?
The beauty of scanning for the cup and handle pattern is that it reduces the search burden. You still apply judgment, but now you are applying it to a much smaller and more relevant list.
Schedule Cup and Handle Pattern Scans
One of the easiest ways to make this workflow more useful is to schedule it.
TrendSpider allows you to automate scans and send the results directly to your email on a recurring basis.
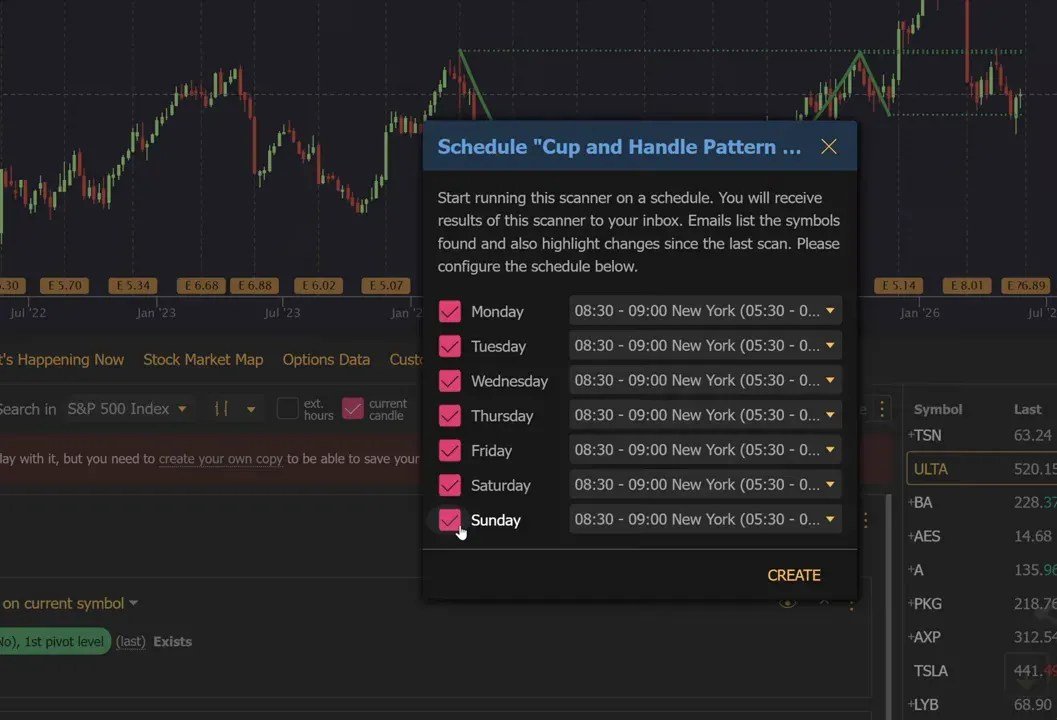
That means you can have fresh cup and handle candidates delivered daily without having to manually rerun the same process every time.
Scheduled scans are especially useful if you:
- Review setups at the same time each day
- Prefer systematic watchlist building
- Want to avoid missing newly formed breakouts
- Trade from a repeatable daily routine
The result is a workflow that stays active in the background.
Instead of searching the market from scratch, you receive a curated stream of setups that already match the pattern and scan logic you care about.
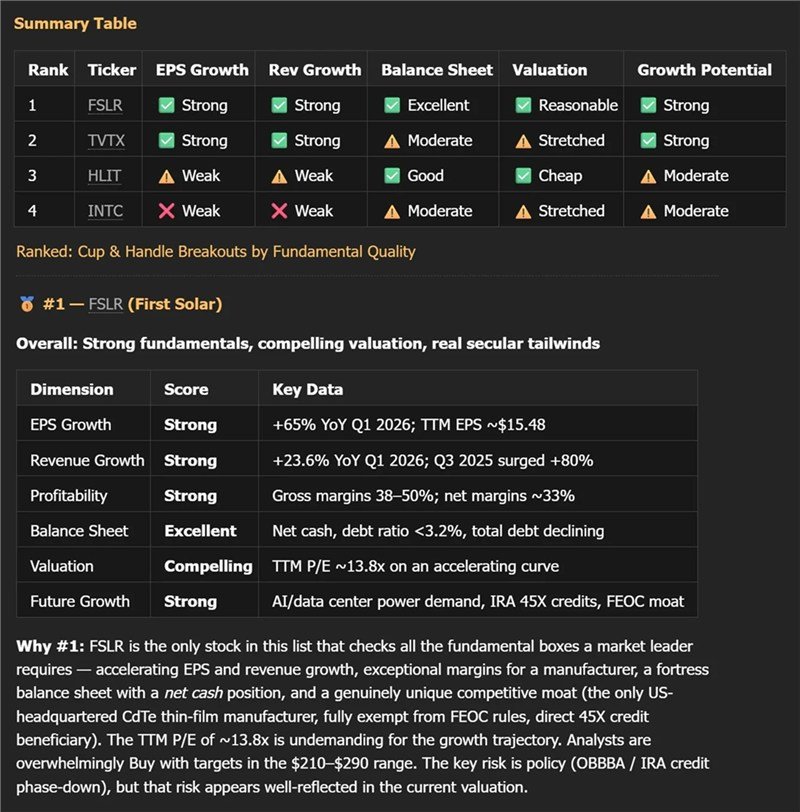
Rank your Watchlist With Sidekick AI
After you have a solid list of candidates, the next challenge is prioritization. Maybe a dozen stocks match the scan. Maybe fifty do. Either way, you still need a way to sort the strongest ideas from the rest.
That is where Sidekick AI comes into the workflow.
After building a watchlist from your cup and handle pattern scans, you can run that list through Sidekick AI and rank the names based on the criteria that matter to you.
The ranking can be guided by factors such as:
- Fundamentals
- News
- Catalysts
- Technicals
- Other custom preferences tied to your process
This is a useful final filter because it helps you avoid treating every pattern match as equally attractive.
Two stocks might both show a clean cup and handle, but one may have stronger growth data, better relative strength, or a more favorable catalyst backdrop.
AI ranking does not replace discretion. It helps narrow attention to the setups most aligned with your criteria so you can review them more efficiently.
A Practical workflow for the Cup and Handle Pattern Scanner
If you want to turn all of this into a repeatable routine, the process can be very simple:
- Enable automatic detection for the cup and handle chart pattern
- Choose the right settings, such as short-term, long-term, or inverse
- Add Fibonacci levels or bands if they support your analysis
- Run the pre-built scans for formed setups and active breakouts
- Optionally use the CANSLIM combination scans for stronger growth filters
- Build a watchlist from the results
- Schedule the scans so fresh setups arrive automatically
- Use Sidekick AI to rank and prioritize the final list
That kind of workflow is what takes pattern trading from theory to execution.
Instead of relying on memory, random chart flipping, or inconsistent manual review, you create a system that continuously surfaces relevant opportunities.
Why This Approach is Useful Even For Pro Traders
Plenty of traders already understand the cup and handle pattern. The bottleneck is usually not education. It is scale, consistency, and speed.
Manually finding the best setups across hundreds or thousands of symbols takes time. It is also easy to miss names that only briefly qualify, especially during active market conditions.
Automatic pattern recognition and scanning solve that problem by making the market searchable in a much more targeted way.
For experienced traders, that means less time spent hunting and more time spent evaluating. For newer traders, it means the learning curve gets easier because the platform is showing examples directly on the chart and pulling candidate setups into one place.
Final Thoughts
The cup and handle chart pattern remains one of the most recognizable breakout structures in growth trading. What has changed is the tooling around it.
With TrendSpider, you are not limited to spotting the pattern by eye. You can automate detection, customize the pattern settings, search for bullish or bearish versions, add Fibonacci context, scan entire universes for formed setups or live breakouts, combine the results with CANSLIM-style filters, and then rank the final list with AI.
That combination turns a classic chart pattern into a modern workflow.
If your goal is to find breakout candidates before they move too far, building a process around the cup and handle chart pattern can give you a faster, more structured way to do it. The edge is not just in recognizing the setup. The edge is in finding it early, filtering it well, and reviewing it consistently.
Try The Scanners
See for yourself how the cup and handle scanners can work for you.
Educational content only, not financial advice.Content may contain affiliate links.