Learn how to pick stocks for beginners, without feeling overwhelmed. Stock screeners show dozens of ratios, finance sites list endless numbers, and it is not always clear which metrics actually matter. That can make stock selection feel far more complicated than it needs to be.
If you are new to investing, the goal is not to master every financial term overnight. It is to build a repeatable process, that helps you judge whether a company is financially sound, reasonably valued, and positioned to hold up over time.
This guide explains how to pick stocks for beginners using a practical checklist. It covers what to look for in a company, how to read the most important financial statements, which valuation metrics matter most. Also, when a beginner may be better off buying an index fund or ETF, instead of individual stocks.
What Beginners Should Focus on When Picking Stocks
At a basic level, buying a stock means buying a small ownership stake in a business. That means the question is not only, “Will the share price go up?” It is also, “Is this a strong business that can keep producing profits and cash over time?”
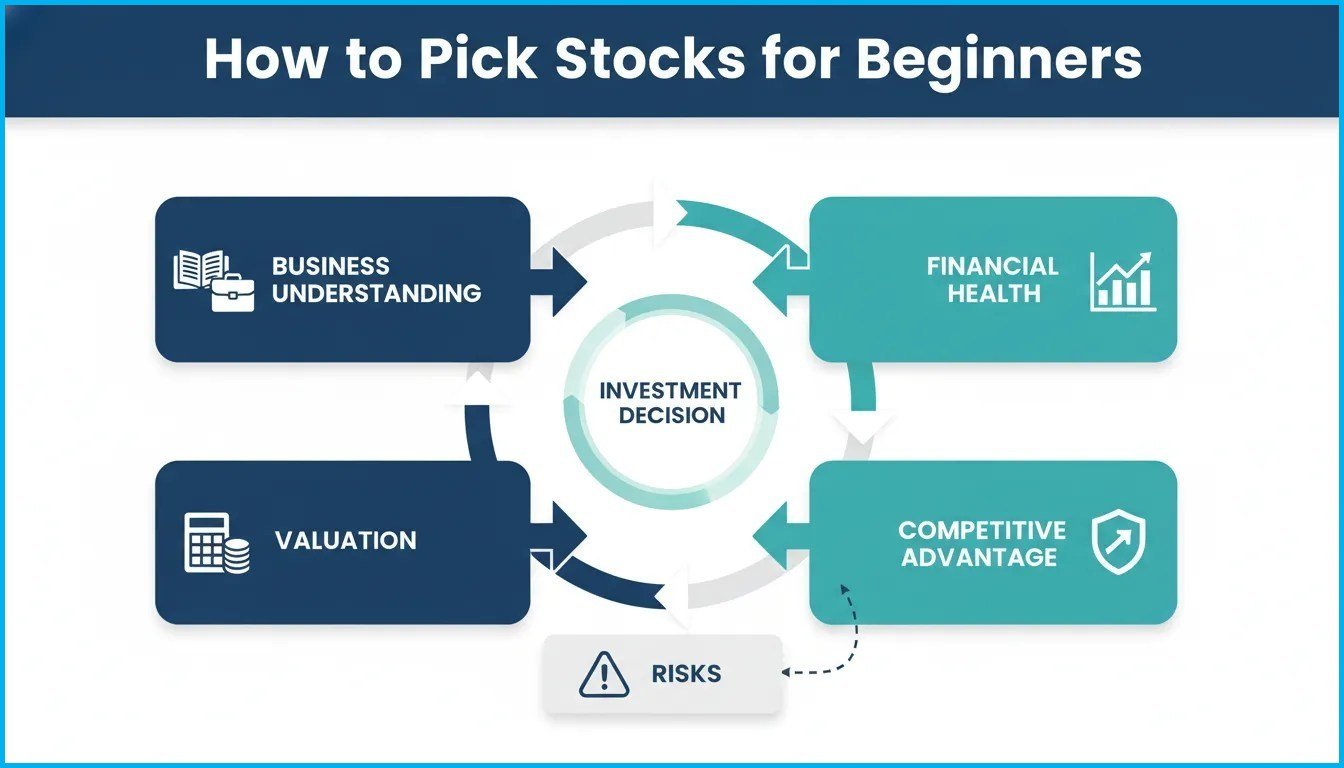
For most new investors, a good stock-picking process should help answer the questions:
- Do you understand the business?
- Does it make money?
- Are the financial statements healthy?
- Is the stock reasonably valued?
- Is management credible and stable?
- Does the company have a competitive advantage?
That is the core of stock picking. You don’t need 50 metrics. You need a repeatable process. For long-term investors, those questions are usually more important than trying to predict short-term price movements.
Let’s take a deeper look into each key point.
Where to Find Company Financial Statements
If you want the official source, public companies file reports with the SEC through EDGAR. Annual reports and quarterly reports provide the raw financial data.
For a more beginner-friendly experience, many investors use charting platforms that organize those statements into easier tables. That makes it faster to compare revenue, debt, profitability, and cash flow over multiple periods.
Recommended For Fundamentals
All the financial data you need can be found on the following charting platforms:
1) Tradingview – Financial data for International Stocks.
2) Stock Rover – Best for fundamental data.
The added benefit of using these platforms is that they work out all the Financial Ratios for you.
Whichever source you use, stick to actual company filings or reputable financial data platforms rather than social media summaries.
1. Start with Companies You Actually Understand
One of the best beginner investing rules is simple: do not invest in businesses you cannot explain.
That does not mean you need expert-level industry knowledge. It means you should understand how the company makes money, what it sells, who its customers are, and why people buy from it.
Familiar businesses are often easier to research because you already have context. If you regularly use a company’s products or services, you may have a clearer sense of its brand strength, customer loyalty, and market presence.
Examples of businesses that are often easier for beginners to analyze include:
- Consumer brands
- Technology products they use
- Retailers they shop from
- Subscription services they pay for
This does not guarantee a stock is a good investment. It simply gives you a better starting point than buying into a complicated business you barely understand.
2. Make Sure The Business is Strong
A common beginner mistake is focusing only on the stock chart. Price matters, but price movement alone does not tell you whether a company is good. A better mindset is to think like someone evaluating a real business.
Before looking at ratios, ask whether the company has a sound economic engine.
A strong business typically has some combination of:
- Reliable demand
- Consistent revenue generation
- Reasonable costs relative to sales
- The ability to produce cash over time
Think of it like buying a real-world business or asset. You would not buy a store, or rental property based only on price charts. You would want to know what it produces, what it costs to operate, and what cash it could generate.
This is an important part of how to pick stocks for beginners. The stronger the business, the easier it is to justify owning it for the long term.
3. The 3 Financial Statements Every Beginner Should Know
When learning how to pick stocks for beginners, financial statements are where the real evidence lives.
The core of fundamental analysis is learning how to read three statements:
- Balance sheet
- Income statement
- Cash flow statement
Together, they show whether a business is financially healthy, profitable, and capable of generating cash.
3A) Balance Sheet: Check Cash, Debt, and Liquidity
The balance sheet shows what a company owns and what it owes. For beginners, two of the most useful checks are:
- Cash position
- Debt
- Liquidity
Cash position helps you see whether the company has enough cash and cash equivalents to handle short-term obligations.
Debt shows how much the company is borrowing relative to what it actually owns. Too much debt can become a serious problem if earnings fall or interest rates rise.
Liquidity shows whether the company can cover upcoming bills with assets that are easy to use in the near term.
A simple question to ask is: Can this business comfortably handle its near-term obligations?
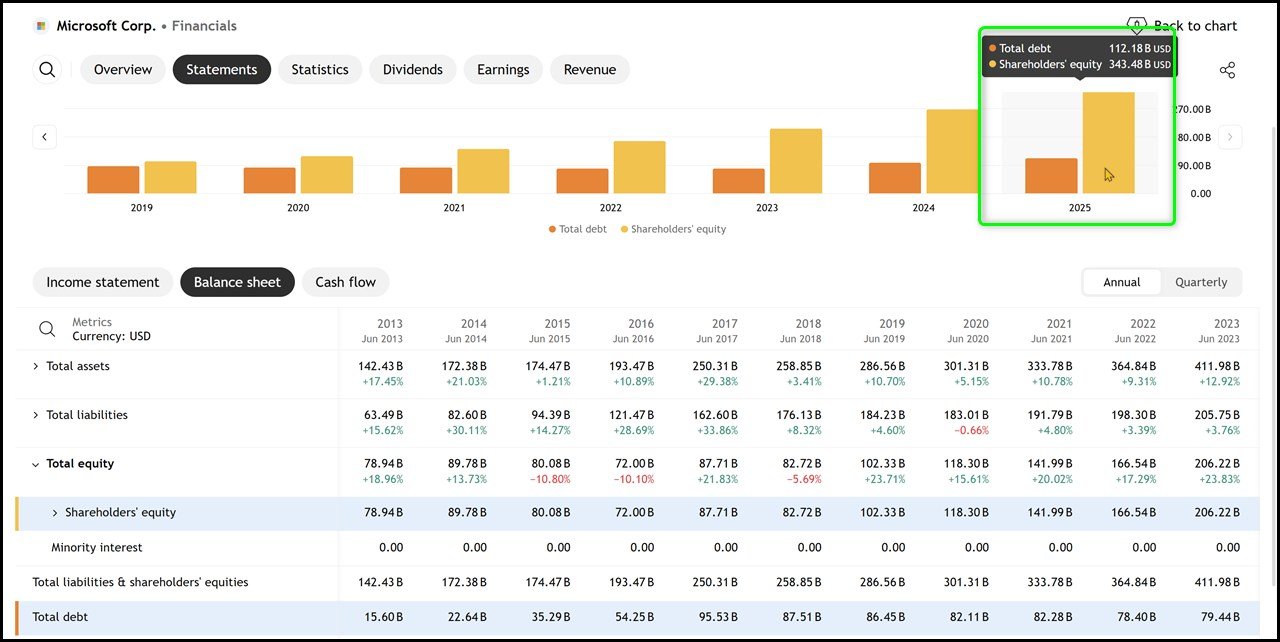
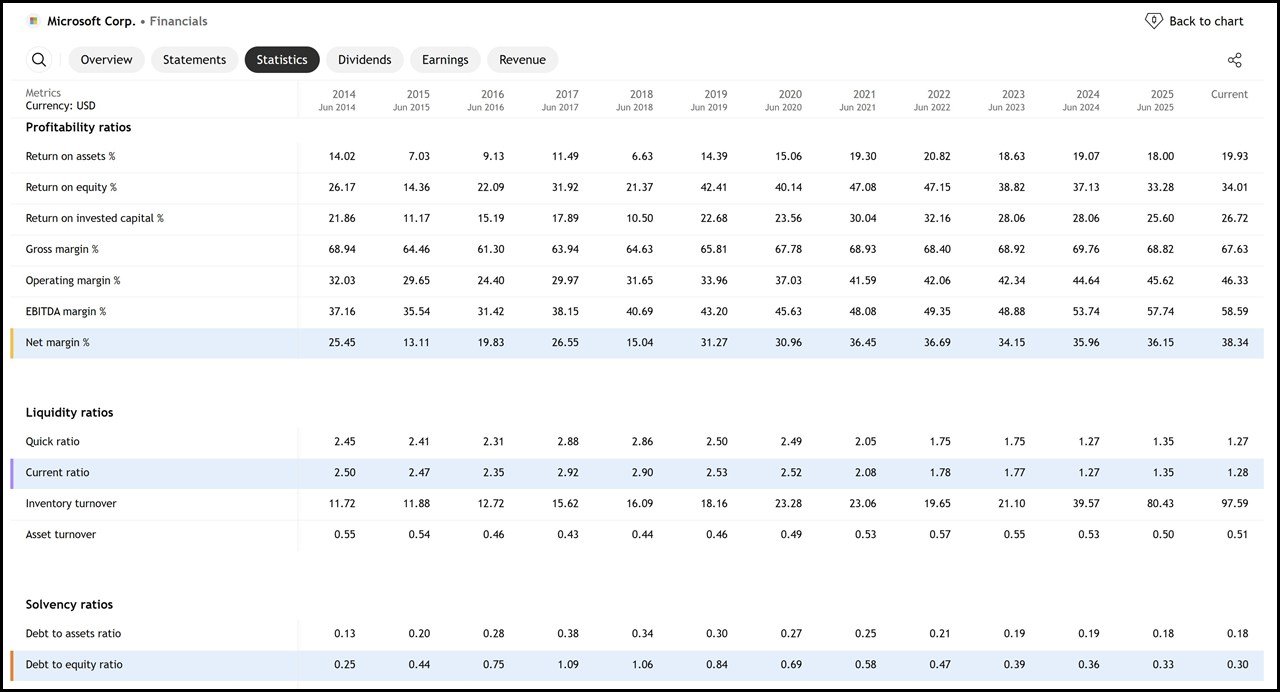
A common debt measure is the debt-to-equity ratio:
Debt-to-Equity = Total Debt ÷ Total Shareholders’ Equity
In general, a lower ratio suggests the company relies more on its own resources than borrowed money. A higher ratio is not automatically bad, some industries carry more debt by nature, but it does mean more risk if conditions turn.
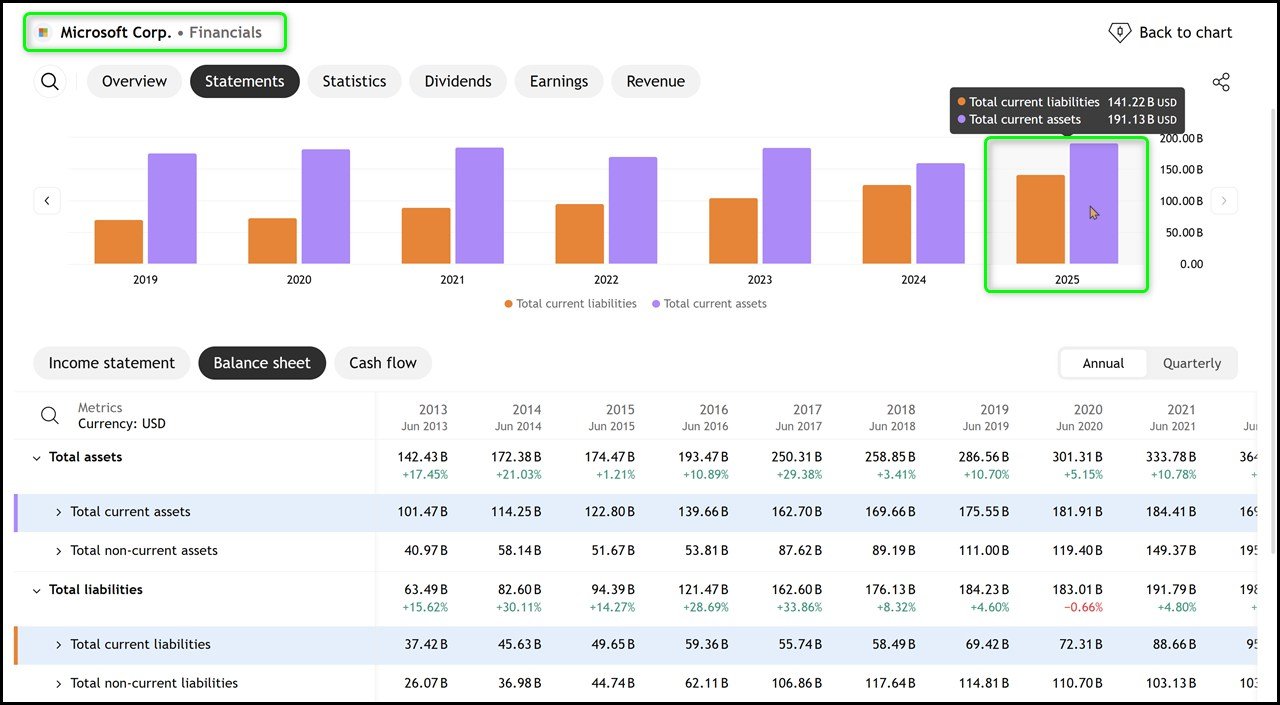
A common liquidity measure is the current ratio:
Current Ratio = Current Assets ÷ Current Liabilities
In general, a ratio above 1 suggests the company has at least enough short-term assets to cover short-term liabilities. That is usually a healthier sign than a ratio well below 1, though context matters by industry.
These are not perfect rules, but they are useful screening tools.
When reviewing the balance sheet, ask:
- How much cash does the company hold?
- How much total debt does the company carry?
- How much debt is due in the next 12 months?
- Is the Current Ratio above 1?
- Does the company appear stretched, or does it have breathing room?
What to watch out for, warning signs:
- Very low cash relative to obligations
- Debt-to-equity ratio rising steadily over time
- Heavy debt loads without strong earnings or cash flow
- Deteriorating liquidity over time
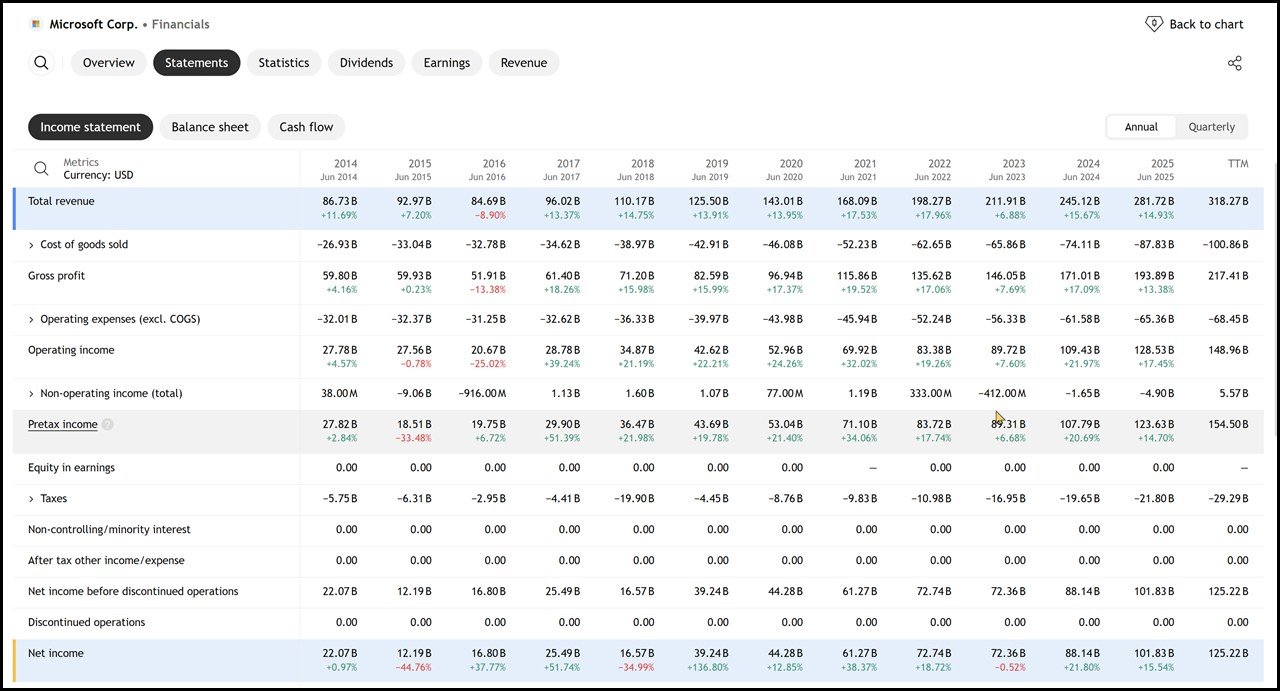
3B) Income statement: Check Revenue, Net Income, and Profit Margin
The income statement shows how much money the company brought in and how much it kept after expenses. This helps you judge whether the business is profitable and how efficiently it operates.
The main items to review are:
- Revenue
- Net income
- Net profit margin
Net profit margin is especially useful:
A common profit margin measure is the net profit margin:
Net Profit Margin = Net Income ÷ Revenue
This tells you how much profit the company keeps from each dollar of sales.
In broad terms, a net margin above 20% is often viewed as strong, while margins above 10% can still be decent depending on the industry.
The key point is consistency. Stable, mature companies often show reliable profitability, while early-stage growth companies may have little or no profit at all.
This is where beginners need to be careful. Some companies are exciting because they are growing fast, but if they are losing money, they are usually harder to value and more speculative.
That does not automatically make them bad investments. Some businesses have gone through long unprofitable phases before becoming dominant.
But for beginners, profitable and stable companies are usually easier to analyze and less stressful to own.
Financial Ratios Make Life Easier
I’ve shown you where to find the relevent financial info to work out the ratios. But you’re going to be glad to know, many of these ratios are already worked out for you on most charting platforms.
Not only does this save you a great deal of time, but many of these ratios can be used in their Stock Screener.
3C) Cash Flow Statement: Focus on Free Cash Flow
The cash flow statement shows how money moves in and out of the business. This matters because accounting profits and actual cash generation are not always the same thing.
One of the most useful concepts here is free cash flow. This is the cash a company has left after funding its operations and necessary capital spending.
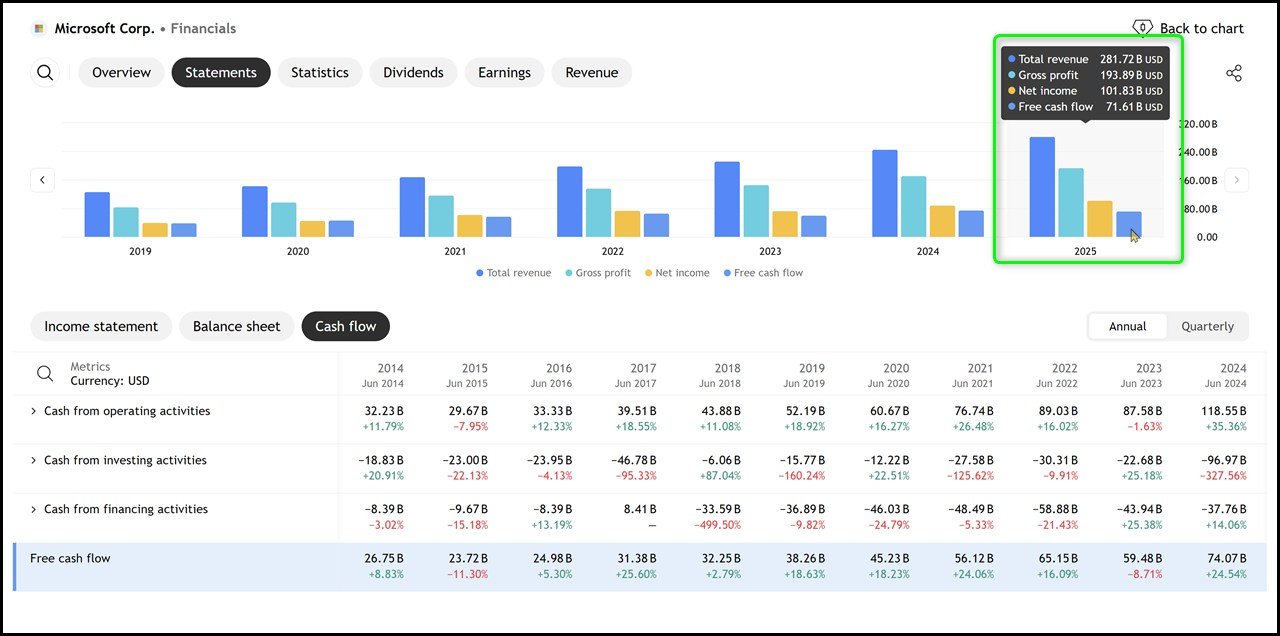
Strong and growing free cash flow matters because it gives a business options.
It can use that cash to:
- Pay down debt
- Pay dividends
- Repurchase shares
- Reinvest in growth
A business that consistently produces cash is generally on firmer ground than one that depends heavily on outside financing just to keep operating.
When evaluating stocks, this is one of the clearest signs of business quality. A company with reliable cash flow usually has more options and more resilience.
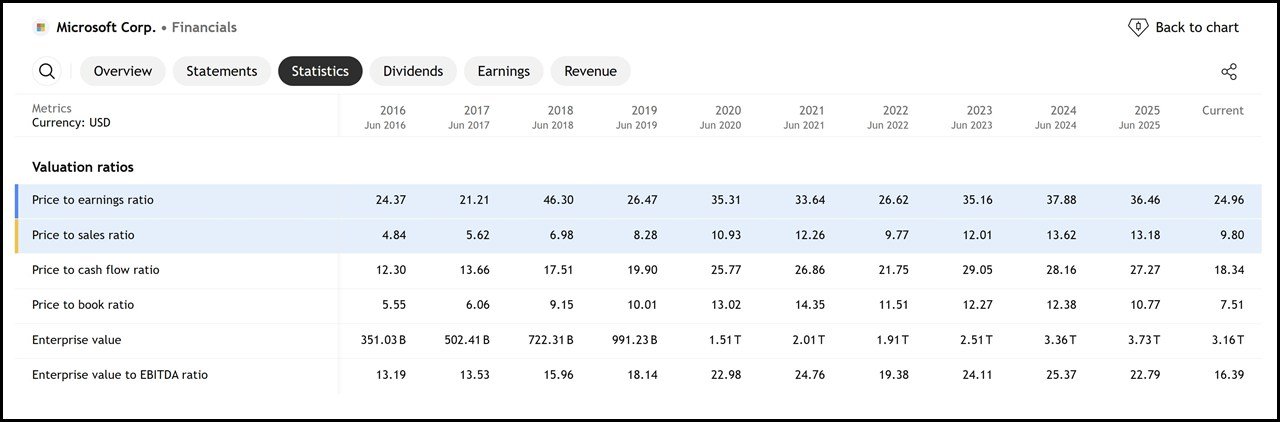
4. Use Valuation Metrics, But Not in Isolation
Once you understand the business and its financial health, the next step is valuation. A great company can still be a poor investment if the stock is far too expensive.
Valuation helps answer whether the market price is reasonable relative to the company’s fundamentals.
Two beginner-friendly valuation metrics are:
- Price-to-earnings ratio (P/E)
- Price-to-sales ratio (P/S)
Price-to-earnings ratio (P/E)
The price-to-earnings ratio compares a stock’s share price to its earnings per share.
P/E Ratio = Share Price ÷ Earnings Per Share
It gives a quick sense of how much investors are paying for each dollar of earnings.
For example, a P/E of 20 means investors are paying $20 for every $1 of earnings.
In general:
- A higher P/E often means investors expect stronger future growth
- A lower P/E may suggest a stock is cheaper, or that the market expects weaker performance
But a low P/E does not automatically mean undervalued, and a high P/E does not automatically mean overvalued.
NOTE: P/E ratio only becomes useful when compared to the right benchmark. Compare companies in the same sector or industry, not in totally different sectors. Technology companies and consumer staples companies often trade at very different valuation levels.
Price-to-sales ratio (P/S)
If a company is not profitable, the P/E ratio may not be useful.
In that case, some investors look at the price-to-sales ratio instead.
P/S Ratio = Share Price ÷ Sales Per Share
This is more common with growth companies that have revenue but little or no profit.
It can help compare early-stage businesses, but it should be used carefully. Sales alone do not guarantee future profits.
The key lesson for beginners is simple: never make a decision from one metric alone.
Always Compare Companies Within The Same Industry
One of the biggest beginner mistakes is comparing valuation metrics across unrelated sectors.
Different industries naturally trade at different multiples. Technology companies often have different valuation ranges than consumer staples, utilities, or banks.
A better approach is to compare:
- The company against similar companies in its industry
- The company against its own historical valuation
- The valuation alongside profitability, growth, and cash flow
No single metric should decide whether you buy a stock.
5. Look at Management Quality and Leadership Stability
Good businesses still need capable leadership. A management team makes decisions about capital allocation, growth strategy, debt, and long-term direction. That is why leadership should be part of any stock review process.
Beginners can start with a few practical checks:
- How long has the CEO been with the company?
- Is the leadership team stable?
- Does management communicate clearly in annual reports and earnings materials?
- Does the board look credible and experienced?
A long-serving executive can be a positive sign, especially if the company has performed well during that period.
Sudden departures of key executives can also matter because markets often react strongly when leadership changes alter expectations.
You don’t need to perform deep forensic analysis here. You just need enough confidence that the people running the company are competent, and their track record is producing good results is often enough to improve decision-making.
6. Check for a real competitive advantage
A company can have good numbers today and still struggle tomorrow if competitors can easily copy what it does. That is why a competitive advantage matters.
A competitive advantage, often called an economic moat, is what helps a company defend its profits and market position over time.
Some common forms of competitive advantage include:
- Strong brand recognition
- Patents or exclusive rights
- Cost advantages
- Superior distribution
- A strong product ecosystem
- Unique technology or innovation
- High switching costs for customers
For example, a pharmaceutical company may benefit from patent protection. A consumer brand may benefit from loyalty and recognition. A technology company may benefit from a sticky ecosystem that makes customers unlikely to switch.
The key question is this: why would this company still be winning five or ten years from now?
If there is no clear answer, the stock may be more vulnerable than it first appears.
Simple Beginner Checklist
Here is a practical checklist you can use before buying any individual stock:
- Understand the business: Can you explain what it does and how it makes money?
- Review the balance sheet: Does it have solid cash and manageable debt?
- Review the income statement: Is revenue growing and is the company profitable?
- Review cash flow: Is the business generating healthy free cash flow?
- Check valuation: Is the P/E or P/S ratio reasonable versus peers?
- Assess management: Is leadership stable and credible?
- Look for an advantage: Does the company have something competitors cannot easily copy?
If a stock fails several of these checks, it may be worth passing and moving on to the next idea.There are thousands of stocks. You do not need to force an investment idea.
Should Beginners Buy Individual Stocks or ETFs?
This is one of the most important questions that beginners ask. Even if you learn how to evaluate stocks, that does not mean you need to build your entire portfolio around individual companies.
Individual stocks may make sense if:
- You enjoy researching businesses
- You understand the added risk
- You want a smaller portion of your portfolio in self-selected names
ETFs may make more sense if:
- You want broad diversification
- You prefer a more hands-off approach
- You are not comfortable analyzing financial statements yet
- You are still building confidence as an investor
Individual stocks can make sense if you enjoy research and are willing to study companies carefully.
For many new investors, ETFs are a strong default option. They provide broad diversification by spreading money across many companies at once. That reduces the impact if any one company performs badly.
Many investors use a mix of both. They keep most of their money in diversified ETFs and use a smaller amount for individual stock ideas.
Can you use Technical Analysis Instead of Fundamentals?
Technical analysis focuses on price charts, trends, and trading patterns. Fundamental analysis focuses on the business itself, including financial statements, profitability, and valuation.
For long-term beginners who want to choose stocks based on business quality, fundamentals are usually the more relevant starting point. Technical tools may be more common among short-term traders, but they do not replace understanding what you own.
Common Mistakes Beginners Make When Picking Stocks
Understanding how to pick stocks for beginners also means understanding what to avoid.
Buying Stocks They Do Not Understand
If the business model is confusing, it is easy to panic later when performance changes.
If you cannot explain the company’s business model in plain language, it is probably too early to invest in it.
Focusing Only on Hype or Price Momentum
A rising stock price does not automatically mean the underlying business is strong.
Ignoring Profitability and Cash Flow
Fast revenue growth can look exciting, but if losses are large and cash burn is heavy, the risk is much higher.
Some loss-making companies eventually become huge winners. Many do not. Beginners should recognize the extra speculation involved.
Using One Metric as The Entire Decision
A low P/E or low price-to-sales ratio is not enough on its own. Cheap stocks can stay cheap for good reasons.
Comparing The Wrong Companies
Compare businesses within the same sector or industry whenever possible. Valuation and margins vary a lot by sector. A low P/E does not automatically mean a stock is cheap. A high P/E does not automatically mean a stock is bad. Context matters.
Putting Too Much Money Into One Stock
Concentration can magnify gains, but it also magnifies mistakes. That is especially risky for beginners. Even well-researched investments can go wrong. Concentration increases the damage from a single mistake.
Summary of The Stock Picking Process
If you want a repeatable method, use this sequence every time:
- Pick one company you already understand.
- Read a basic company description and identify how it makes money.
- Check the balance sheet for cash, debt, and current ratio.
- Check the income statement for revenue, net income, and margin.
- Check the cash flow statement for free cash flow direction.
- Review the P/E or P/S ratio against similar companies.
- Look at management stability and any obvious competitive advantages.
- Does it have a clear competitive advantage.
That process is simple enough for a beginner, but strong enough to prevent many avoidable mistakes. You do not need to become an expert immediately. What matters is developing a disciplined process and avoiding uninformed bets.
Final takeaway
Learning how to pick stocks for beginners does not require mastering every ratio on a stock screener. What matters most is building a process you can use consistently.
If a company has a strong business model, healthy financial statements, capable leadership, and a real competitive advantage, it may deserve closer attention.
If you cannot confidently explain why the business should succeed over time, it is usually better to pass.
The goal is not to find a perfect stock every time. The goal is to make better decisions, avoid obvious mistakes, and build a portfolio on solid reasoning instead of guesswork.
And if picking individual stocks still feels overwhelming, broad ETFs remain a strong alternative. Investing does not have to be complicated to be effective.
Recommended
All the financial data you need can be found on the following charting platforms:
1) Tradingview – Financial data for International Stocks.
2) Stock Rover – Best for fundamental data.
The added benefit of using these platforms is that they work out all the Financial Ratios for you.
Educational content only, not financial advice.Content may contain affiliate links.